## Line Graph: ROC-AUC Performance vs. Scaling Factor λ
### Overview
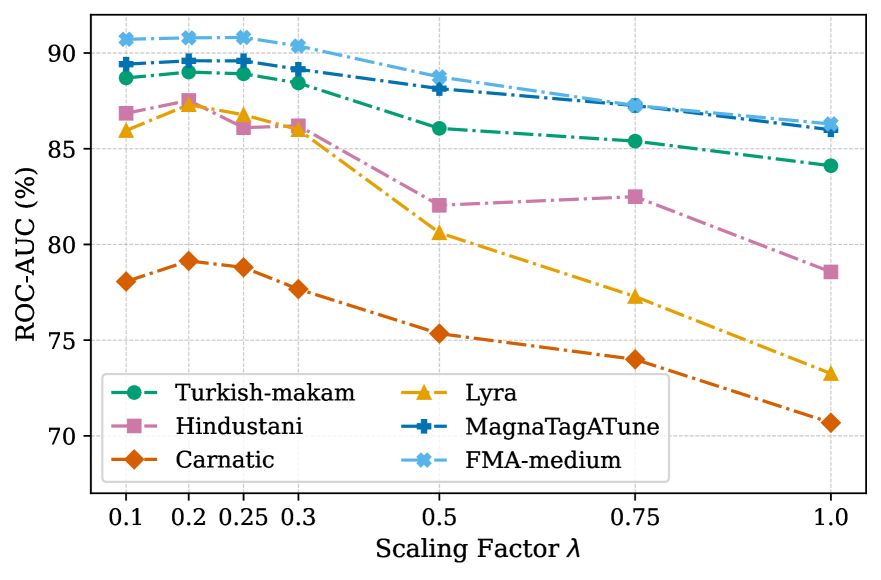
The image is a line graph comparing the ROC-AUC (%) performance of six audio processing methods across different scaling factors (λ). The x-axis represents the scaling factor (λ) ranging from 0.1 to 1.0, while the y-axis shows ROC-AUC performance (70–90%). Six data series are plotted with distinct line styles and markers, each corresponding to a specific method.
### Components/Axes
- **X-axis**: Scaling Factor λ (0.1, 0.2, 0.25, 0.3, 0.5, 0.75, 1.0)
- **Y-axis**: ROC-AUC (%) (70–90% in 5% increments)
- **Legend**: Located at the bottom-left, mapping colors/markers to methods:
- **Turkish-makam**: Green circles (dashed line)
- **Lyra**: Orange triangles (dotted line)
- **Hindustani**: Pink squares (dash-dot line)
- **MagnaTagATune**: Blue plus signs (solid line)
- **FMA-medium**: Light blue crosses (dashed line)
- **Carnatic**: Orange diamonds (dotted line)
### Detailed Analysis
1. **Turkish-makam** (Green circles):
- Starts at ~88% ROC-AUC at λ=0.1, declines steadily to ~84% at λ=1.0.
- Trend: Gradual downward slope.
2. **Lyra** (Orange triangles):
- Peaks at ~87% at λ=0.2, then drops sharply to ~73% at λ=1.0.
- Trend: Initial rise followed by steep decline.
3. **Hindustani** (Pink squares):
- Starts at ~86% at λ=0.1, dips to ~82% at λ=0.5, then stabilizes at ~78% at λ=1.0.
- Trend: Moderate decline with plateau.
4. **MagnaTagATune** (Blue plus signs):
- Maintains ~89% ROC-AUC across all λ values, with minimal fluctuation.
- Trend: Flat line.
5. **FMA-medium** (Light blue crosses):
- Consistently highest performance (~90% at λ=0.1, ~86% at λ=1.0).
- Trend: Slight downward slope.
6. **Carnatic** (Orange diamonds):
- Declines from ~78% at λ=0.1 to ~71% at λ=1.0.
- Trend: Steady downward slope.
### Key Observations
- **FMA-medium** and **MagnaTagATune** exhibit the most stable performance, with FMA-medium achieving the highest ROC-AUC values.
- **Lyra** and **Carnatic** show significant degradation as λ increases, with Lyra dropping ~14% and Carnatic dropping ~7%.
- **Turkish-makam** and **Hindustani** demonstrate moderate declines, with Turkish-makam retaining higher performance than Hindustani at higher λ values.
- **Lyra** and **Hindustani** intersect at λ=0.25 (~86% ROC-AUC), indicating crossover in performance.
### Interpretation
The data suggests that audio processing methods vary in robustness to scaling factor adjustments. **FMA-medium** and **MagnaTagATune** are the most resilient, maintaining high ROC-AUC across all λ values. In contrast, **Lyra** and **Carnatic** are highly sensitive to scaling, with performance dropping sharply as λ increases. The crossover between Lyra and Hindustani at λ=0.25 highlights that optimal scaling factors are method-dependent. These trends imply that method selection should consider the expected λ range in deployment scenarios. The consistent performance of FMA-medium and MagnaTagATune positions them as preferred choices for applications requiring stability under scaling variations.