## Heatmap: Classification Accuracies
### Overview
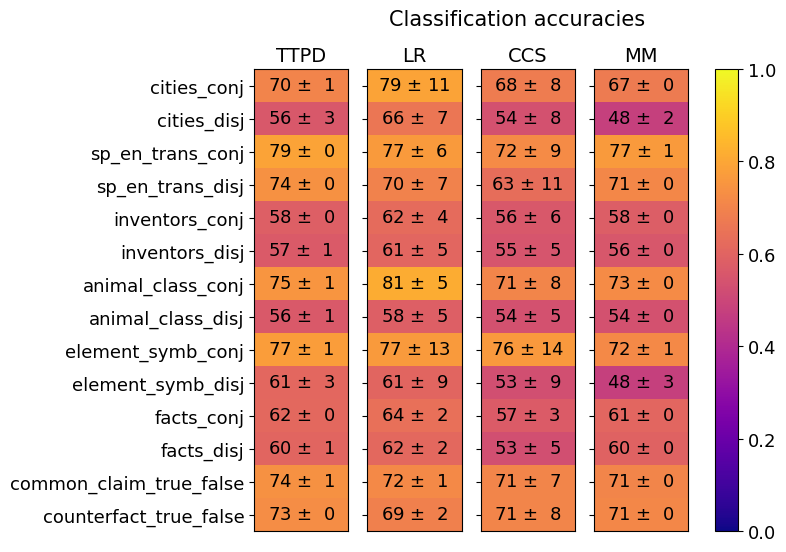
The image is a heatmap displaying classification accuracies for different models (TTPD, LR, CCS, MM) across various tasks. The color intensity represents the accuracy score, ranging from dark blue (low accuracy) to bright yellow (high accuracy). Each cell contains the accuracy value and its associated uncertainty.
### Components/Axes
* **Title:** Classification accuracies
* **Columns (Models):** TTPD, LR, CCS, MM
* **Rows (Tasks):** cities\_conj, cities\_disj, sp\_en\_trans\_conj, sp\_en\_trans\_disj, inventors\_conj, inventors\_disj, animal\_class\_conj, animal\_class\_disj, element\_symb\_conj, element\_symb\_disj, facts\_conj, facts\_disj, common\_claim\_true\_false, counterfact\_true\_false
* **Colorbar (Accuracy):** Ranges from 0.0 (dark blue) to 1.0 (bright yellow), with intermediate values of 0.2, 0.4, 0.6, and 0.8.
### Detailed Analysis
Here's a breakdown of the accuracy values for each model and task:
* **TTPD:**
* cities\_conj: 70 ± 1
* cities\_disj: 56 ± 3
* sp\_en\_trans\_conj: 79 ± 0
* sp\_en\_trans\_disj: 74 ± 0
* inventors\_conj: 58 ± 0
* inventors\_disj: 57 ± 1
* animal\_class\_conj: 75 ± 1
* animal\_class\_disj: 56 ± 1
* element\_symb\_conj: 77 ± 1
* element\_symb\_disj: 61 ± 3
* facts\_conj: 62 ± 0
* facts\_disj: 60 ± 1
* common\_claim\_true\_false: 74 ± 1
* counterfact\_true\_false: 73 ± 0
* **LR:**
* cities\_conj: 79 ± 11
* cities\_disj: 66 ± 7
* sp\_en\_trans\_conj: 77 ± 6
* sp\_en\_trans\_disj: 70 ± 7
* inventors\_conj: 62 ± 4
* inventors\_disj: 61 ± 5
* animal\_class\_conj: 81 ± 5
* animal\_class\_disj: 58 ± 5
* element\_symb\_conj: 77 ± 13
* element\_symb\_disj: 61 ± 9
* facts\_conj: 64 ± 2
* facts\_disj: 62 ± 2
* common\_claim\_true\_false: 72 ± 1
* counterfact\_true\_false: 69 ± 2
* **CCS:**
* cities\_conj: 68 ± 8
* cities\_disj: 54 ± 8
* sp\_en\_trans\_conj: 72 ± 9
* sp\_en\_trans\_disj: 63 ± 11
* inventors\_conj: 56 ± 6
* inventors\_disj: 55 ± 5
* animal\_class\_conj: 71 ± 8
* animal\_class\_disj: 54 ± 5
* element\_symb\_conj: 76 ± 14
* element\_symb\_disj: 53 ± 9
* facts\_conj: 57 ± 3
* facts\_disj: 53 ± 5
* common\_claim\_true\_false: 71 ± 7
* counterfact\_true\_false: 71 ± 8
* **MM:**
* cities\_conj: 67 ± 0
* cities\_disj: 48 ± 2
* sp\_en\_trans\_conj: 77 ± 1
* sp\_en\_trans\_disj: 71 ± 0
* inventors\_conj: 58 ± 0
* inventors\_disj: 56 ± 0
* animal\_class\_conj: 73 ± 0
* animal\_class\_disj: 54 ± 0
* element\_symb\_conj: 72 ± 1
* element\_symb\_disj: 48 ± 3
* facts\_conj: 61 ± 0
* facts\_disj: 60 ± 0
* common\_claim\_true\_false: 71 ± 0
* counterfact\_true\_false: 71 ± 0
### Key Observations
* The "animal\_class\_conj" task generally has higher accuracy across all models compared to "animal\_class\_disj".
* The LR model achieves the highest accuracy on the "animal\_class\_conj" task (81 ± 5).
* The MM model has the lowest accuracy on the "cities\_disj" and "element\_symb\_disj" tasks (48 ± 2 and 48 ± 3, respectively).
* The uncertainty (error) varies significantly across models and tasks, with LR and CCS often having larger uncertainties.
### Interpretation
The heatmap provides a comparative view of the classification performance of four different models on a suite of tasks. The color gradient allows for a quick visual assessment of relative performance. The inclusion of uncertainty values is crucial for understanding the reliability of the accuracy scores.
The data suggests that the LR model performs well on the "animal\_class\_conj" task, while the MM model struggles with "cities\_disj" and "element\_symb\_disj". The varying uncertainties highlight the need for careful consideration when comparing model performance, as some models may have more consistent results than others. Further analysis could involve investigating the nature of the tasks and the characteristics of the models to understand the underlying reasons for the observed performance differences.