\n
## Heatmap: Classification Accuracies
### Overview
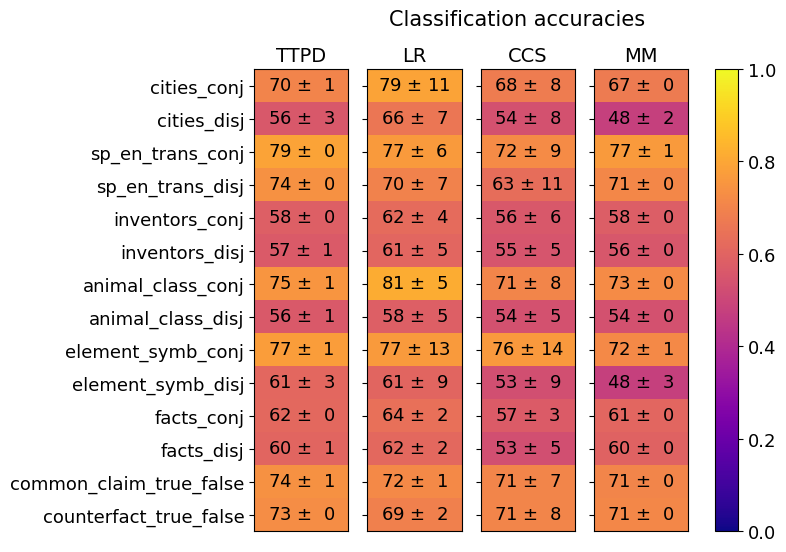
This image presents a heatmap visualizing classification accuracies for several datasets and methods. The heatmap displays the performance of four different methods (TTPD, LR, CCS, MM) across ten different datasets, each represented in both conjunctive ('conj') and disjunctive ('disj') forms. The color intensity represents the accuracy, with warmer colors (yellow) indicating higher accuracy and cooler colors (blue) indicating lower accuracy. A colorbar on the right indicates the accuracy scale from 0.0 to 1.0.
### Components/Axes
* **X-axis (Methods):** TTPD, LR, CCS, MM
* **Y-axis (Datasets):**
* cities\_conj
* cities\_disj
* sp\_en\_trans\_conj
* sp\_en\_trans\_disj
* inventors\_conj
* inventors\_disj
* animal\_class\_conj
* animal\_class\_disj
* element\_symb\_conj
* element\_symb\_disj
* facts\_conj
* facts\_disj
* common\_claim\_true\_false
* counterfact\_true\_false
* **Colorbar:** Represents accuracy ranging from 0.0 (blue) to 1.0 (yellow).
* **Title:** "Classification accuracies" (positioned at the top-center)
* **Data Points:** Each cell in the heatmap represents the accuracy of a specific method on a specific dataset, along with a standard deviation.
### Detailed Analysis
The heatmap contains 48 data points (4 methods x 12 datasets). Each data point is represented as "Accuracy ± Standard Deviation". Here's a breakdown of the data, row by row:
* **cities\_conj:** TTPD: 70 ± 1, LR: 79 ± 11, CCS: 68 ± 8, MM: 67 ± 0
* **cities\_disj:** TTPD: 56 ± 3, LR: 66 ± 7, CCS: 54 ± 8, MM: 48 ± 2
* **sp\_en\_trans\_conj:** TTPD: 79 ± 0, LR: 77 ± 6, CCS: 72 ± 9, MM: 77 ± 1
* **sp\_en\_trans\_disj:** TTPD: 74 ± 0, LR: 70 ± 7, CCS: 63 ± 11, MM: 71 ± 0
* **inventors\_conj:** TTPD: 58 ± 0, LR: 62 ± 4, CCS: 56 ± 6, MM: 58 ± 0
* **inventors\_disj:** TTPD: 57 ± 1, LR: 61 ± 5, CCS: 55 ± 5, MM: 56 ± 0
* **animal\_class\_conj:** TTPD: 75 ± 1, LR: 81 ± 5, CCS: 71 ± 8, MM: 73 ± 0
* **animal\_class\_disj:** TTPD: 56 ± 1, LR: 58 ± 5, CCS: 54 ± 5, MM: 54 ± 0
* **element\_symb\_conj:** TTPD: 77 ± 1, LR: 77 ± 13, CCS: 76 ± 14, MM: 72 ± 1
* **element\_symb\_disj:** TTPD: 61 ± 3, LR: 61 ± 9, CCS: 53 ± 9, MM: 48 ± 3
* **facts\_conj:** TTPD: 62 ± 0, LR: 64 ± 2, CCS: 57 ± 3, MM: 61 ± 0
* **facts\_disj:** TTPD: 60 ± 1, LR: 62 ± 2, CCS: 53 ± 5, MM: 60 ± 0
* **common\_claim\_true\_false:** TTPD: 74 ± 1, LR: 72 ± 1, CCS: 71 ± 7, MM: 71 ± 0
* **counterfact\_true\_false:** TTPD: 73 ± 0, LR: 69 ± 2, CCS: 71 ± 8, MM: 71 ± 0
**Trends:**
* **LR generally performs well:** The LR method consistently achieves high accuracy across most datasets, often being the highest performing method.
* **TTPD is variable:** TTPD's performance varies significantly depending on the dataset.
* **Disjunctive form often lower accuracy:** For many datasets, the 'disj' (disjunctive) form results in lower accuracy compared to the 'conj' (conjunctive) form.
* **MM is consistently lower:** MM consistently shows lower accuracy compared to other methods.
### Key Observations
* The highest accuracy observed is 81 ± 5 (LR on animal\_class\_conj).
* The lowest accuracy observed is 48 ± 2 (MM on cities\_disj).
* The standard deviations are generally small (mostly ± 0 to ± 5), indicating relatively consistent performance.
* The 'element\_symb\_conj' dataset shows high variance in CCS accuracy (76 ± 14).
### Interpretation
This heatmap provides a comparative analysis of four classification methods across a diverse set of datasets. The data suggests that the LR method is generally the most robust and accurate, consistently achieving high performance. The difference in accuracy between the 'conj' and 'disj' forms of the datasets suggests that the conjunctive representation is more amenable to accurate classification by these methods. The relatively small standard deviations indicate that the observed performance differences are likely statistically significant. The heatmap is a valuable tool for selecting the most appropriate classification method for a given dataset, and for understanding the impact of dataset representation (conjunctive vs. disjunctive) on classification accuracy. The high variance in CCS accuracy for 'element\_symb\_conj' warrants further investigation to understand the factors contributing to this inconsistency.