## Heatmap: Classification accuracies
### Overview
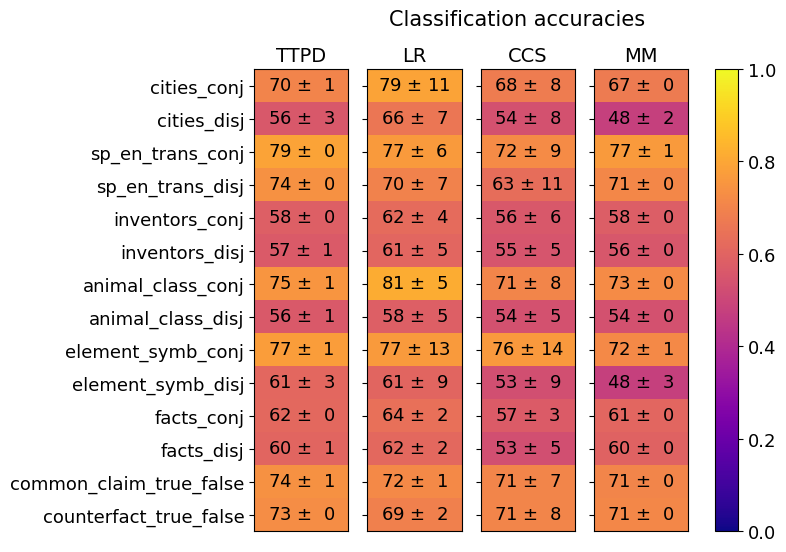
The image is a heatmap visualizing classification accuracies across 14 categories (rows) and 4 methods (columns). Each cell contains a numerical value with a standard deviation (e.g., "70 ± 1"), and colors range from purple (low accuracy) to yellow (high accuracy). The legend on the right maps values to colors, with 0.0 (purple) to 1.0 (yellow).
### Components/Axes
- **X-axis (Methods)**: TTPD, LR, CCS, MM (left to right).
- **Y-axis (Categories)**: 14 rows labeled as:
- cities_conj, cities_disj
- sp_en_trans_conj, sp_en_trans_disj
- inventors_conj, inventors_disj
- animal_class_conj, animal_class_disj
- element_symb_conj, element_symb_disj
- facts_conj, facts_disj
- common_claim_true_false, counterfact_true_false
- **Legend**: Color scale from 0.0 (purple) to 1.0 (yellow), with intermediate shades (orange, red).
### Detailed Analysis
- **Methods**:
- **TTPD**: Highest accuracy in `cities_conj` (70 ± 1), `sp_en_trans_conj` (79 ± 0), and `animal_class_conj` (75 ± 1). Lowest in `cities_disj` (56 ± 3) and `element_symb_disj` (61 ± 3).
- **LR**: Highest in `animal_class_conj` (81 ± 5). Lowest in `cities_disj` (66 ± 7) and `element_symb_disj` (61 ± 9).
- **CCS**: Highest in `element_symb_conj` (76 ± 14). Lowest in `cities_disj` (54 ± 8) and `element_symb_disj` (53 ± 9).
- **MM**: Highest in `sp_en_trans_conj` (77 ± 1) and `animal_class_conj` (73 ± 0). Lowest in `cities_disj` (48 ± 2) and `element_symb_disj` (48 ± 3).
- **Standard Deviations**:
- TTPD and LR show lower variability (e.g., `sp_en_trans_conj` ± 0, `animal_class_conj` ± 1).
- CCS and MM exhibit higher variability (e.g., `element_symb_conj` ± 14, `cities_conj` ± 8).
### Key Observations
1. **TTPD and LR** generally outperform CCS and MM in most categories, particularly in `cities_conj`, `sp_en_trans_conj`, and `animal_class_conj`.
2. **MM** underperforms in `cities_disj` (48 ± 2) and `element_symb_disj` (48 ± 3), with the lowest accuracy in the latter.
3. **CCS** shows mixed performance, with high accuracy in `element_symb_conj` (76 ± 14) but low in `cities_disj` (54 ± 8).
4. **Standard deviations** vary significantly: TTPD and LR have tighter confidence intervals, while CCS and MM show higher uncertainty (e.g., `element_symb_conj` ± 14).
### Interpretation
The heatmap reveals that **TTPD and LR** are the most consistent and accurate methods across most categories, particularly in conjunction-based tasks (`_conj`). **MM** struggles with disjunction-based tasks (`_disj`), especially in `cities_disj` and `element_symb_disj`, where accuracy drops below 50%. **CCS** performs well in conjunction tasks but falters in disjunction tasks. The standard deviations highlight that methods like TTPD and LR are more reliable, while CCS and MM exhibit higher variability, suggesting potential instability in their predictions. The color gradient confirms that higher values (yellow) align with better performance, while lower values (purple) indicate weaker accuracy.