## Diagram: Process Challenges and System Limitations
### Overview
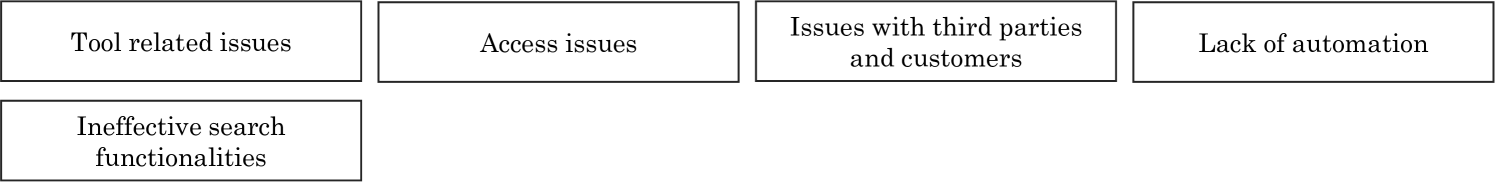
The image depicts a structured diagram with labeled rectangular components arranged in two rows. The top row contains four horizontally aligned boxes, while the bottom row contains one box. All labels are written in English, with no additional text, colors, or numerical data present.
### Components/Axes
- **Top Row (Left to Right):**
1. **Tool related issues**
2. **Access issues**
3. **Issues with third parties and customers**
4. **Lack of automation**
- **Bottom Row (Centered):**
1. **Ineffective search functionalities**
No legends, axes, or numerical scales are visible. The diagram lacks directional flow indicators (e.g., arrows) or hierarchical relationships between components.
### Detailed Analysis
- **Labels:** All text is explicitly listed above. No embedded text or annotations are present.
- **Spatial Arrangement:**
- The top row components are evenly spaced and aligned horizontally.
- The bottom row component is centered below the top row, suggesting a potential thematic or categorical separation.
- **Content:** No numerical values, percentages, or quantitative data are included.
### Key Observations
1. The diagram categorizes challenges into five distinct areas, with four grouped in the top row and one isolated in the bottom row.
2. The isolation of "Ineffective search functionalities" may imply it is a standalone or secondary concern compared to the top-row issues.
3. No visual indicators (e.g., color coding, size variation) differentiate the components, suggesting equal priority or a non-hierarchical structure.
### Interpretation
This diagram likely represents common pain points or failure modes in a technical or operational system. The separation of "Ineffective search functionalities" into a standalone category could indicate it is either:
- A less frequent but critical issue,
- A sub-problem under a broader category (e.g., "Tool related issues"), or
- A distinct challenge requiring independent resolution.
The lack of flow or connectivity between components suggests these issues are treated as independent variables rather than part of a causal chain. Further context (e.g., system type, industry) would clarify relationships between these challenges.
**Note:** The image contains no factual data, trends, or quantitative insights. It serves as a categorical framework for identifying system limitations.