## Line Chart: I-Don't-Know Rate vs. Layer for Mistral Models
### Overview
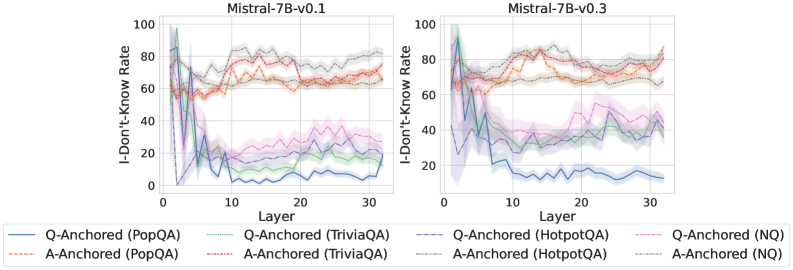
The image presents two line charts, side-by-side, comparing the "I-Don't-Know Rate" across different layers of two Mistral language models: Mistral-7B-v0.1 and Mistral-7B-v0.3. The x-axis represents the "Layer" (ranging from 0 to 30), and the y-axis represents the "I-Don't-Know Rate" (ranging from 0 to 100). Each chart displays multiple lines, each representing a different question-answering dataset and anchoring method. The charts are visually similar, with the primary difference being the specific rates observed for each model.
### Components/Axes
* **X-axis:** Layer (0 to 30)
* **Y-axis:** I-Don't-Know Rate (0 to 100)
* **Left Chart Title:** Mistral-7B-v0.1
* **Right Chart Title:** Mistral-7B-v0.3
* **Legend (Bottom):**
* Blue Line: Q-Anchored (PopQA)
* Orange Line: A-Anchored (PopQA)
* Green Line: Q-Anchored (TriviaQA)
* Purple Line: A-Anchored (TriviaQA)
* Gray Dashed Line: Q-Anchored (HotpotQA)
* Red Dashed Line: A-Anchored (HotpotQA)
* Light Blue Line: Q-Anchored (NQ)
* Light Purple Line: A-Anchored (NQ)
### Detailed Analysis or Content Details
**Mistral-7B-v0.1 (Left Chart):**
* **Q-Anchored (PopQA) - Blue Line:** Starts at approximately 80, rapidly decreases to around 10 by layer 5, then fluctuates between 5 and 20 for the remainder of the layers.
* **A-Anchored (PopQA) - Orange Line:** Starts at approximately 80, decreases more gradually than the Q-Anchored version, reaching around 40 by layer 5, and then stabilizes between 40 and 60.
* **Q-Anchored (TriviaQA) - Green Line:** Starts at approximately 70, decreases to around 30 by layer 5, and then fluctuates between 30 and 50.
* **A-Anchored (TriviaQA) - Purple Line:** Starts at approximately 70, decreases to around 40 by layer 5, and then stabilizes between 40 and 60.
* **Q-Anchored (HotpotQA) - Gray Dashed Line:** Starts at approximately 80, decreases to around 40 by layer 5, and then fluctuates between 30 and 50.
* **A-Anchored (HotpotQA) - Red Dashed Line:** Starts at approximately 80, decreases to around 50 by layer 5, and then stabilizes between 50 and 70.
* **Q-Anchored (NQ) - Light Blue Line:** Starts at approximately 60, decreases to around 10 by layer 5, and then fluctuates between 10 and 20.
* **A-Anchored (NQ) - Light Purple Line:** Starts at approximately 60, decreases to around 30 by layer 5, and then stabilizes between 30 and 50.
**Mistral-7B-v0.3 (Right Chart):**
* **Q-Anchored (PopQA) - Blue Line:** Starts at approximately 80, rapidly decreases to around 10 by layer 5, then fluctuates between 10 and 20 for the remainder of the layers.
* **A-Anchored (PopQA) - Orange Line:** Starts at approximately 80, decreases more gradually than the Q-Anchored version, reaching around 40 by layer 5, and then stabilizes between 40 and 60.
* **Q-Anchored (TriviaQA) - Green Line:** Starts at approximately 70, decreases to around 30 by layer 5, and then fluctuates between 30 and 50.
* **A-Anchored (TriviaQA) - Purple Line:** Starts at approximately 70, decreases to around 40 by layer 5, and then stabilizes between 40 and 60.
* **Q-Anchored (HotpotQA) - Gray Dashed Line:** Starts at approximately 80, decreases to around 40 by layer 5, and then fluctuates between 30 and 50.
* **A-Anchored (HotpotQA) - Red Dashed Line:** Starts at approximately 80, decreases to around 50 by layer 5, and then stabilizes between 50 and 70.
* **Q-Anchored (NQ) - Light Blue Line:** Starts at approximately 60, decreases to around 10 by layer 5, and then fluctuates between 10 and 20.
* **A-Anchored (NQ) - Light Purple Line:** Starts at approximately 60, decreases to around 30 by layer 5, and then stabilizes between 30 and 50.
### Key Observations
* All lines exhibit a steep initial decrease in "I-Don't-Know Rate" from layer 0 to layer 5.
* The "Q-Anchored" lines generally have lower "I-Don't-Know Rates" than the "A-Anchored" lines, especially after layer 5.
* The "PopQA" and "NQ" datasets consistently show lower "I-Don't-Know Rates" compared to "TriviaQA" and "HotpotQA".
* The Mistral-7B-v0.3 model generally exhibits slightly lower "I-Don't-Know Rates" across all datasets and anchoring methods compared to Mistral-7B-v0.1.
* After layer 5, the lines tend to stabilize, indicating that the model's knowledge reaches a plateau.
### Interpretation
The charts demonstrate how the "I-Don't-Know Rate" changes as information propagates through the layers of the Mistral language models. The initial steep decline suggests that the early layers are crucial for acquiring basic knowledge. The subsequent stabilization indicates that the model has learned most of what it can from the training data.
The difference between "Q-Anchored" and "A-Anchored" suggests that the method of anchoring questions and answers impacts the model's confidence. "Q-Anchored" methods, which likely focus on the question itself, lead to lower "I-Don't-Know Rates," implying the model is more confident when directly addressing the query.
The varying rates across datasets ("PopQA", "TriviaQA", "HotpotQA", "NQ") highlight the model's performance differences depending on the complexity and nature of the questions. "PopQA" and "NQ" appear to be easier for the model to answer, resulting in lower "I-Don't-Know Rates."
The slight improvement in Mistral-7B-v0.3 compared to Mistral-7B-v0.1 suggests that the model updates have led to a more knowledgeable and confident model, as evidenced by the consistently lower "I-Don't-Know Rates." This could be due to changes in the training data, model architecture, or training process.