## Line Chart: Mistral-7B Model "I-Don't-Know Rate" by Layer
### Overview
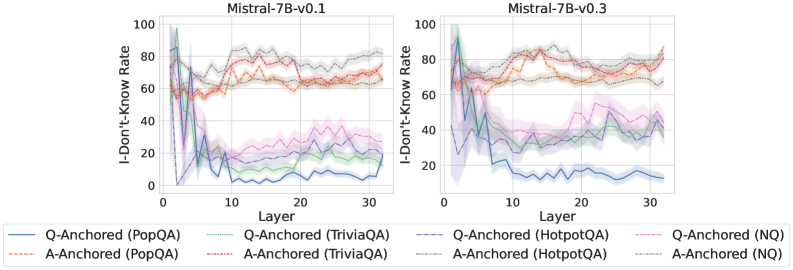
The image displays two side-by-side line charts comparing the "I-Don't-Know Rate" across the 32 layers (0-31) of two versions of the Mistral-7B language model: version 0.1 (left) and version 0.3 (right). The charts analyze this rate using two different methods ("Q-Anchored" and "A-Anchored") across four different question-answering datasets (PopQA, TriviaQA, HotpotQA, NQ). The data suggests an investigation into how model uncertainty or refusal behavior changes across its internal layers and between model versions.
### Components/Axes
* **Chart Titles:** "Mistral-7B-v0.1" (left chart), "Mistral-7B-v0.3" (right chart).
* **X-Axis:** Labeled "Layer". Linear scale from 0 to 30, with major tick marks every 10 units (0, 10, 20, 30). Represents the layer index within the neural network.
* **Y-Axis:** Labeled "I-Don't-Know Rate". Linear scale from 0 to 100, with major tick marks every 20 units (0, 20, 40, 60, 80, 100). Represents a percentage rate.
* **Legend:** Positioned below both charts, centered. Contains 8 entries, differentiating lines by color and style (solid vs. dashed).
* **Solid Lines (Q-Anchored):**
* Blue: Q-Anchored (PopQA)
* Green: Q-Anchored (TriviaQA)
* Purple: Q-Anchored (HotpotQA)
* Pink: Q-Anchored (NQ)
* **Dashed Lines (A-Anchored):**
* Orange: A-Anchored (PopQA)
* Red: A-Anchored (TriviaQA)
* Gray: A-Anchored (HotpotQA)
* Brown: A-Anchored (NQ)
* **Data Series:** Each chart contains 8 lines, one for each legend entry. Each line is accompanied by a semi-transparent shaded area of the same color, likely representing a confidence interval or standard deviation.
### Detailed Analysis
**Mistral-7B-v0.1 (Left Chart):**
* **Q-Anchored Series (Solid Lines):** All four series show a similar, dramatic trend. They start at a very high rate (approximately 80-100%) at Layer 0. There is a sharp, precipitous drop within the first 5 layers, falling to between ~0% and ~40%. After this initial drop, the rates stabilize at a low level for the remaining layers (5-31), with minor fluctuations. The PopQA (blue) line ends the lowest, near 0%. The HotpotQA (purple) and NQ (pink) lines remain slightly higher, fluctuating between ~20-40%.
* **A-Anchored Series (Dashed Lines):** These series exhibit a completely different pattern. They start at a moderate rate (approximately 50-70%) at Layer 0. Instead of dropping, they show a general, gradual upward trend across layers, ending between ~60% and ~80% at Layer 31. The lines are tightly clustered, with the HotpotQA (gray) and NQ (brown) series appearing slightly higher than PopQA (orange) and TriviaQA (red) in the later layers.
**Mistral-7B-v0.3 (Right Chart):**
* **Q-Anchored Series (Solid Lines):** The pattern is similar to v0.1 but less extreme. Rates start high (70-100%) at Layer 0 and drop sharply in the first ~5 layers. However, the post-drop stabilization occurs at a higher level compared to v0.1. The PopQA (blue) line again drops the lowest, to around 10-20%. The other three (TriviaQA-green, HotpotQA-purple, NQ-pink) stabilize in a band between approximately 30% and 50%.
* **A-Anchored Series (Dashed Lines):** The trend is again a gradual increase from Layer 0 to Layer 31, starting around 60-70% and ending between ~70% and ~90%. The clustering is similar to v0.1, with HotpotQA (gray) and NQ (brown) generally at the top of the cluster.
### Key Observations
1. **Method-Driven Dichotomy:** The most striking pattern is the fundamental difference between the Q-Anchored (solid) and A-Anchored (dashed) methods. Q-Anchored rates collapse in early layers, while A-Anchored rates build gradually.
2. **Early Layer Criticality:** For the Q-Anchored method, the first 5 layers are decisive, where the "I-Don't-Know" behavior is largely determined.
3. **Model Version Difference:** Mistral-7B-v0.3 shows higher stabilized "I-Don't-Know" rates for the Q-Anchored method (except PopQA) compared to v0.1, suggesting a change in the model's internal processing of uncertainty.
4. **Dataset Sensitivity:** The PopQA dataset (blue/orange) consistently yields the lowest rates for both methods across both model versions, indicating it may be an easier or different type of dataset for the model. HotpotQA and NQ often show the highest rates.
### Interpretation
This data visualizes how two different probing techniques ("Q-Anchored" vs. "A-Anchored") reveal opposing narratives about a language model's internal "knowledge" or "confidence" across its layers.
* The **Q-Anchored** method (likely probing based on the question) suggests that the model's initial layers contain a high degree of uncertainty or a default "I don't know" state, which is rapidly resolved or suppressed by layer 5. This could indicate that early layers perform a kind of "reality check" or initial processing that quickly moves away from a state of non-knowledge.
* The **A-Anchored** method (likely probing based on the answer) suggests the opposite: that certainty or answer-related information builds up gradually throughout the network. This could reflect the progressive assembly or refinement of an answer representation.
* The contrast implies that "knowing" is not a monolithic property within the model. The model's state can be interpreted as highly uncertain from one perspective (question-focused) while simultaneously becoming more committed from another (answer-focused), especially in the later layers.
* The difference between v0.1 and v0.3 suggests that model updates can significantly alter these internal dynamics, particularly the baseline level of uncertainty maintained in the mid-to-layers when probed with the Q-Anchored method. The consistent outlier behavior of PopQA warrants further investigation into its characteristics relative to the other datasets.