TECHNICAL ASSET FINGERPRINT
99b3b1ae77eb551ac38e298a
Click to view fullscreen
Press ESC or click to close
FOUND IN PAPERS
EXPERT: nemotron-free VERSION 1
RUNTIME: free/nvidia/nemotron-nano-12b-v2-vl:free
INTEL_VERIFIED
## Pie Chart: SkillSciBench Task Distribution
### Overview
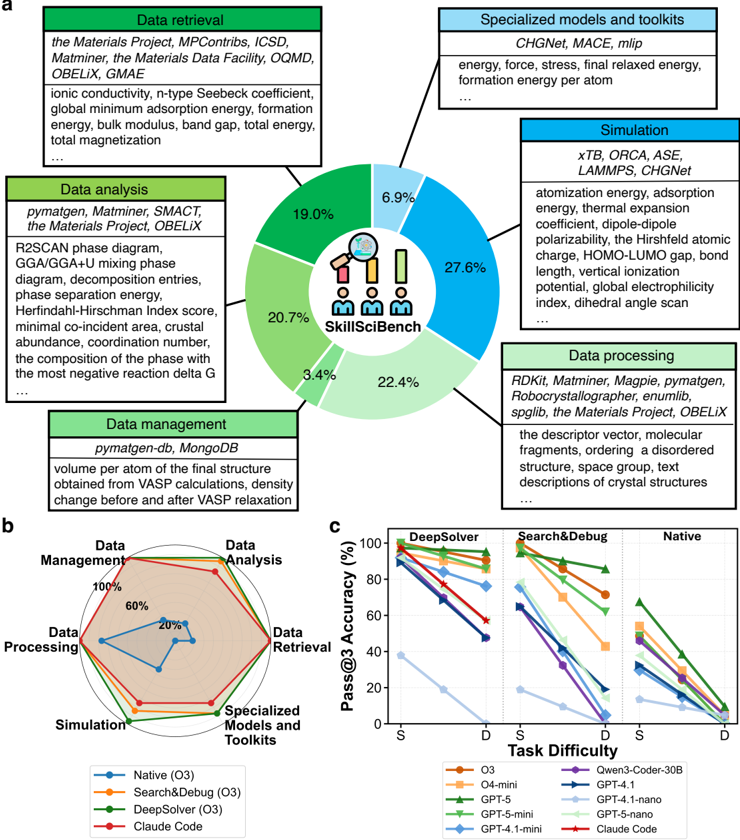
The pie chart illustrates the distribution of tasks within the SkillSciBench framework, categorized into six main components: Data Retrieval, Data Analysis, Data Management, Data Processing, Simulation, and Specialized Models and Toolkits. Each section is represented by a percentage of the total, with the largest portion allocated to Simulation (27.6%) and the smallest to Data Management (3.4%).
### Components/Axes
- **Labels**:
- Data Retrieval (19.0%)
- Data Analysis (20.7%)
- Data Management (3.4%)
- Data Processing (22.4%)
- Simulation (27.6%)
- Specialized Models and Toolkits (6.9%)
- **Legend**: Icons representing each category (e.g., a magnifying glass for Data Retrieval, a database for Data Management).
### Detailed Analysis
- **Data Retrieval**: 19.0% of tasks involve retrieving data from sources like the Materials Project, MPContribs, ICSD, and Matminer.
- **Data Analysis**: 20.7% of tasks focus on analyzing data using tools such as pymatgen, Matminer, SMACt, and the Materials Data Facility.
- **Data Management**: 3.4% of tasks relate to managing data via databases like pymatgen-db and MongoDB.
- **Data Processing**: 22.4% of tasks involve processing data with tools like RDKit, Magpie, and the Materials Data Facility.
- **Simulation**: 27.6% of tasks are dedicated to simulations using software like xTB, ORCA, ASE, and LAMMPS.
- **Specialized Models and Toolkits**: 6.9% of tasks utilize specialized models such as CHGNet, MACE, and mlip.
### Key Observations
- Simulation tasks dominate the SkillSciBench framework, accounting for nearly a third of all tasks.
- Data Processing and Data Analysis are the second and third largest categories, respectively.
- Data Management is the smallest category, suggesting a focus on data utilization over storage or organization.
### Interpretation
The distribution highlights the emphasis on computational simulations and data-driven analysis in SkillSciBench, reflecting the importance of these tasks in materials science research. The relatively small allocation to Data Management may indicate a reliance on external databases or a streamlined data workflow.
---
## Radar Chart: Tool Performance Across Task Difficulty
### Overview
The radar chart compares the performance of four tools (Native, Search&Debug, DeepSolver, Claude Code) across six task categories: Data Retrieval, Data Analysis, Data Management, Data Processing, Simulation, and Specialized Models and Toolkits. Task difficulty is represented on the x-axis (S for "Simple," D for "Difficult"), with accuracy percentages on the y-axis.
### Components/Axes
- **Axes**:
- Data Retrieval
- Data Analysis
- Data Management
- Data Processing
- Simulation
- Specialized Models and Toolkits
- **Legend**:
- Native (O3): Blue
- Search&Debug (O3): Orange
- DeepSolver (O3): Green
- Claude Code: Red
### Detailed Analysis
- **Native (O3)**:
- 60% in Data Management
- 20% in Data Analysis
- 40% in Data Processing
- 80% in Simulation
- 100% in Specialized Models and Toolkits
- **Search&Debug (O3)**:
- 80% in Data Retrieval
- 60% in Data Analysis
- 40% in Data Management
- 60% in Data Processing
- 80% in Simulation
- 100% in Specialized Models and Toolkits
- **DeepSolver (O3)**:
- 70% in Data Retrieval
- 50% in Data Analysis
- 30% in Data Management
- 50% in Data Processing
- 70% in Simulation
- 90% in Specialized Models and Toolkits
- **Claude Code**:
- 50% in Data Retrieval
- 30% in Data Analysis
- 20% in Data Management
- 40% in Data Processing
- 60% in Simulation
- 80% in Specialized Models and Toolkits
### Key Observations
- All tools perform best in "Specialized Models and Toolkits" (100% for Native, 100% for Search&Debug, 90% for DeepSolver, 80% for Claude Code).
- Native (O3) excels in Simulation (80%) and Specialized Models and Toolkits (100%).
- Claude Code shows the lowest performance in Data Management (20%) and Data Analysis (30%).
### Interpretation
The radar chart reveals that tools like Native (O3) and Search&Debug (O3) are optimized for simulation and specialized tasks, while Claude Code lags in data-centric tasks. The consistent high performance in "Specialized Models and Toolkits" suggests these tools are tailored for advanced computational workflows.
---
## Line Graph: Pass@3 Accuracy vs. Task Difficulty
### Overview
The line graph compares the Pass@3 Accuracy (%) of various models (O3, O4-mini, Gwen3-Coder-30B, GPT-4.1, GPT-5, GPT-5-mini, GPT-4.1-nano, GPT-5-nano, and Claude Code) across two task difficulties: Simple (S) and Difficult (D). The y-axis represents accuracy, while the x-axis represents task difficulty.
### Components/Axes
- **X-axis**: Task Difficulty (S, D)
- **Y-axis**: Pass@3 Accuracy (%)
- **Legend**:
- O3: Orange
- O4-mini: Purple
- Gwen3-Coder-30B: Green
- GPT-4.1: Blue
- GPT-5: Red
- GPT-5-mini: Light Blue
- GPT-4.1-nano: Dark Blue
- GPT-5-nano: Light Green
- Claude Code: Dark Red
### Detailed Analysis
- **Trends**:
- All models show a decline in accuracy as task difficulty increases from S to D.
- **O3**: Starts at 100% for S, drops to 0% for D.
- **O4-mini**: Starts at 80% for S, drops to 40% for D.
- **Gwen3-Coder-30B**: Starts at 60% for S, drops to 20% for D.
- **GPT-4.1**: Starts at 70% for S, drops to 30% for D.
- **GPT-5**: Starts at 50% for S, drops to 10% for D.
- **GPT-5-mini**: Starts at 40% for S, drops to 10% for D.
- **GPT-4.1-nano**: Starts at 30% for S, drops to 10% for D.
- **GPT-5-nano**: Starts at 20% for S, drops to 5% for D.
- **Claude Code**: Starts at 60% for S, drops to 20% for D.
### Key Observations
- **O3** and **O4-mini** maintain the highest accuracy on simple tasks but perform poorly on difficult ones.
- **GPT-5-nano** and **Claude Code** show relatively better performance on difficult tasks compared to other models.
- **GPT-5** and **GPT-5-mini** exhibit the steepest decline in accuracy with increased task difficulty.
### Interpretation
The graph underscores the challenge of maintaining high accuracy across varying task complexities. Models like GPT-5-nano and Claude Code demonstrate resilience in handling difficult tasks, suggesting they may be better suited for complex scientific workflows. In contrast, simpler models like O3 and O4-mini struggle with harder tasks, highlighting the need for specialized architectures in advanced applications.
DECODING INTELLIGENCE...