## Histogram: First Correct Answer Emergence in Decoding Steps
### Overview
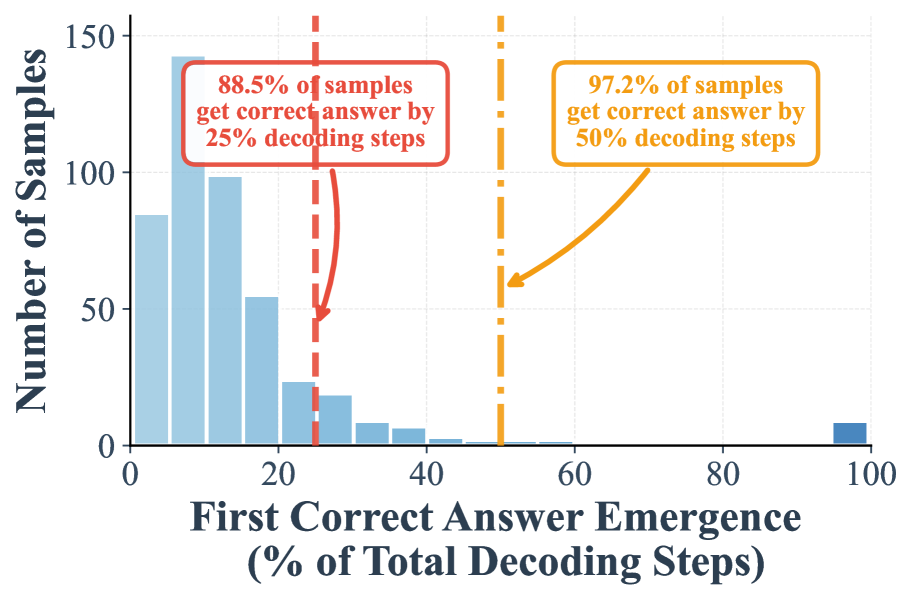
This image is a histogram chart illustrating the distribution of when a model first produces a correct answer during a decoding process, measured as a percentage of the total decoding steps. The chart includes two annotated thresholds highlighting the cumulative percentage of samples that achieve correctness by specific points in the process.
### Components/Axes
* **X-Axis:** Labeled "First Correct Answer Emergence (% of Total Decoding Steps)". It is a linear scale ranging from 0 to 100, with major tick marks at 0, 20, 40, 60, 80, and 100.
* **Y-Axis:** Labeled "Number of Samples". It is a linear scale ranging from 0 to 150, with major tick marks at 0, 50, 100, and 150.
* **Data Series:** A single data series represented by light blue vertical bars (a histogram). The bars show the frequency (count) of samples for which the first correct answer emerged within specific percentage bins of the decoding steps.
* **Annotations:**
1. A **red dashed vertical line** is positioned at approximately **25%** on the x-axis. An associated red-bordered text box in the upper-left quadrant states: "88.5% of samples get correct answer by 25% decoding steps". A red arrow points from this text box to the red dashed line.
2. An **orange dashed vertical line** is positioned at approximately **50%** on the x-axis. An associated orange-bordered text box in the upper-right quadrant states: "97.2% of samples get correct answer by 50% decoding steps". An orange arrow points from this text box to the orange dashed line.
### Detailed Analysis
* **Histogram Distribution:** The distribution is heavily right-skewed. The tallest bars are concentrated on the far left side of the chart, between 0% and 20% on the x-axis.
* The highest bar appears in the bin just after 0%, reaching a value of approximately **140 samples**.
* The next bar (around 10%) is slightly lower, at approximately **100 samples**.
* The bar around 20% is at approximately **55 samples**.
* The frequency drops sharply after 20%, with bars at 25%, 30%, 35%, and 40% showing progressively smaller counts (roughly 25, 20, 10, and 5 samples, respectively).
* There is a very small, isolated bar at the far right end of the axis, at **100%**, representing a small number of samples (approximately **5-10**) where the first correct answer emerged only at the very last decoding step.
* **Annotated Thresholds:**
* The **red annotation** indicates that a cumulative **88.5%** of all samples have produced their first correct answer by the time **25%** of the total decoding steps are completed.
* The **orange annotation** indicates that a cumulative **97.2%** of all samples have produced their first correct answer by the time **50%** of the total decoding steps are completed.
### Key Observations
1. **Early Convergence:** The vast majority of samples (over 88%) converge on a correct answer very early in the process, within the first quarter of the allocated decoding steps.
2. **Diminishing Returns:** After the 50% mark, only a marginal 2.8% (100% - 97.2%) of remaining samples achieve their first correct answer. The process yields correct answers for new samples at a drastically reduced rate in the second half of the decoding steps.
3. **Long Tail Outlier:** A small but non-zero number of samples (the bar at 100%) require the entire decoding budget to produce a correct answer for the first time, representing a "long tail" of difficult cases.
### Interpretation
This histogram demonstrates the efficiency and behavior of a decoding algorithm (likely for a language or generative model). The data suggests the model is highly effective at finding correct solutions quickly for most inputs, as evidenced by the massive concentration of "first correct answer" events in the initial 25% of steps. The sharp drop-off after 25% and the plateau after 50% indicate that if a correct answer hasn't emerged early, the probability of it emerging later diminishes significantly. The small cluster at 100% may represent particularly challenging samples, edge cases, or potential failures where the model only stumbles upon the correct answer at the deadline. For practical application, this data could justify implementing early stopping criteria (e.g., at 50% of steps) to save computational resources with minimal loss in accuracy, as nearly all correct answers have already been found by that point.