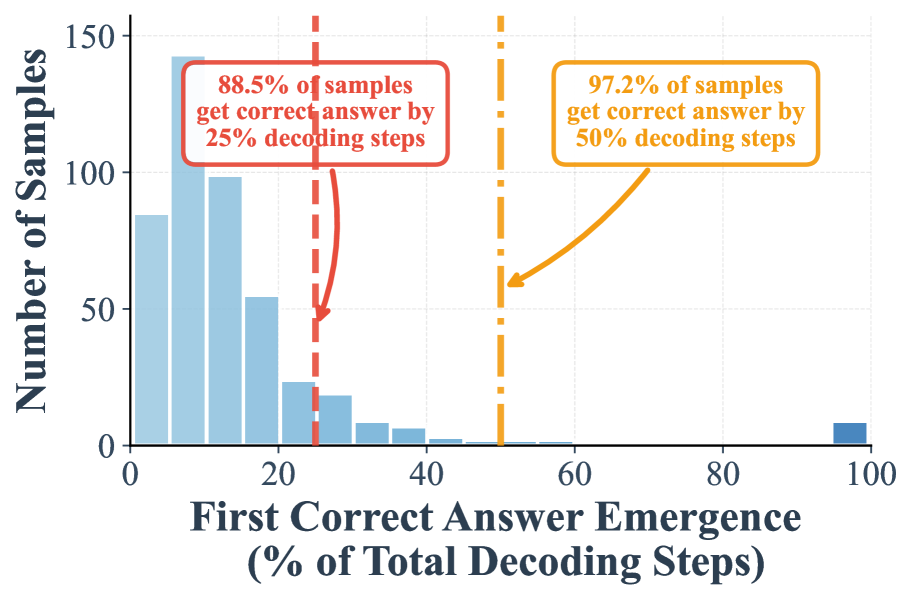
## Bar Chart: First Correct Answer Emergence (% of Total Decoding Steps)
### Overview
The chart visualizes the distribution of samples based on the percentage of total decoding steps required for the first correct answer to emerge. It highlights two key thresholds: 25% and 50% decoding steps, with annotations indicating the cumulative percentage of samples achieving correctness at these points.
### Components/Axes
- **X-axis**: "First Correct Answer Emergence (% of Total Decoding Steps)"
- Scale: 0% to 100% in 20% increments.
- Notable markers:
- Red dashed line at 25% (annotated: "88.5% of samples get correct answer by 25% decoding steps").
- Orange dashed line at 50% (annotated: "97.2% of samples get correct answer by 50% decoding steps").
- **Y-axis**: "Number of Samples"
- Scale: 0 to 150 in 50-unit increments.
- **Bars**: Blue, representing sample counts for each percentage bin.
### Detailed Analysis
- **Data Distribution**:
- The majority of samples (highest bar) fall in the 0–10% range (~140 samples).
- Sample counts decrease progressively across bins:
- 10–20%: ~100 samples.
- 20–30%: ~55 samples.
- 30–40%: ~25 samples.
- 40–50%: ~10 samples.
- 50–60%: ~2 samples.
- 60–70%: ~1 sample.
- 70–80%, 80–90%, 90–100%: ~1 sample each.
- The final bin (90–100%) contains ~5 samples.
- **Threshold Annotations**:
- At 25% decoding steps (red line), 88.5% of samples achieve correctness.
- At 50% decoding steps (orange line), 97.2% of samples achieve correctness.
### Key Observations
1. **Rapid Initial Improvement**: Over 88% of samples resolve within the first 25% of decoding steps.
2. **Diminishing Returns**: Additional decoding steps beyond 25% yield minimal gains (only 8.7% additional samples correct between 25% and 50%).
3. **Long-Tail Distribution**: A small fraction of samples (≤5) require nearly the full decoding process (90–100%).
### Interpretation
The chart demonstrates that the model achieves high accuracy early in the decoding process, with diminishing returns as more steps are added. This suggests:
- **Efficiency**: The model is highly effective at generating correct answers quickly, making it suitable for applications requiring rapid inference.
- **Robustness**: The 25% threshold captures most samples, indicating strong performance even with limited computational resources.
- **Outliers**: The long tail (90–100% range) highlights edge cases where the model struggles, potentially pointing to ambiguities or complexities in those inputs.
The annotations confirm that 97.2% of samples are resolved by 50% decoding steps, implying the model’s performance stabilizes well before full decoding. This could inform optimizations for real-time systems or resource-constrained environments.