## Scatter Plot: Accuracy Variance vs. Client ID for N=100, CIFAR-10
### Overview
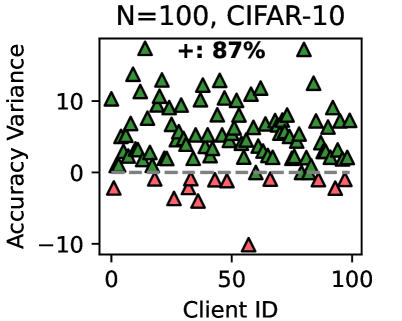
The image is a scatter plot showing the accuracy variance for different clients (Client ID) in a system trained on the CIFAR-10 dataset with N=100. The plot displays the variance in accuracy for each client, with data points represented as triangles. Green triangles indicate positive variance, while red triangles indicate negative variance. A dashed gray line represents the zero-variance baseline. The plot also indicates that 87% of the clients have positive accuracy variance.
### Components/Axes
* **Title:** N=100, CIFAR-10
* **X-axis:** Client ID, ranging from 0 to 100.
* **Y-axis:** Accuracy Variance, ranging from -10 to 10.
* **Data Points:** Green triangles (positive variance) and red triangles (negative variance).
* **Zero-Variance Baseline:** Dashed gray line at y=0.
* **Percentage of Positive Variance:** "+: 87%" located at the top of the plot.
### Detailed Analysis
* **X-Axis (Client ID):** The x-axis represents the Client ID, ranging from 0 to 100 in increments of 50.
* **Y-Axis (Accuracy Variance):** The y-axis represents the Accuracy Variance, ranging from -10 to 10 in increments of 10.
* **Data Point Distribution:**
* The majority of data points are green triangles, indicating positive accuracy variance.
* A smaller number of data points are red triangles, indicating negative accuracy variance.
* The data points are scattered across the range of Client IDs.
* **Zero-Variance Baseline:** The dashed gray line at y=0 serves as a reference point to easily distinguish between positive and negative accuracy variance.
* **Percentage of Positive Variance:** The "+: 87%" indicates that 87% of the clients have positive accuracy variance.
### Key Observations
* **Dominance of Positive Variance:** The plot visually confirms that a significant majority of clients have positive accuracy variance, as indicated by the "+: 87%".
* **Variance Range:** The accuracy variance ranges from approximately -10 to 13.
* **Outliers:** There is one notable outlier, a red triangle (negative variance) at Client ID ~55 with an accuracy variance of approximately -10.
### Interpretation
The scatter plot illustrates the distribution of accuracy variance across different clients in a system trained on the CIFAR-10 dataset. The dominance of green triangles (positive variance) suggests that, overall, the system performs well across most clients. The "+: 87%" reinforces this observation, indicating that 87% of the clients experience positive accuracy variance.
The presence of red triangles (negative variance) indicates that some clients perform worse than average. The outlier at Client ID ~55 with an accuracy variance of approximately -10 suggests a particularly poor performance for that specific client.
The plot highlights the variability in performance across different clients and suggests that further investigation may be needed to understand the factors contributing to the negative variance observed in some clients. This could involve analyzing the data distribution for those clients, the model's performance on specific classes, or other client-specific characteristics.