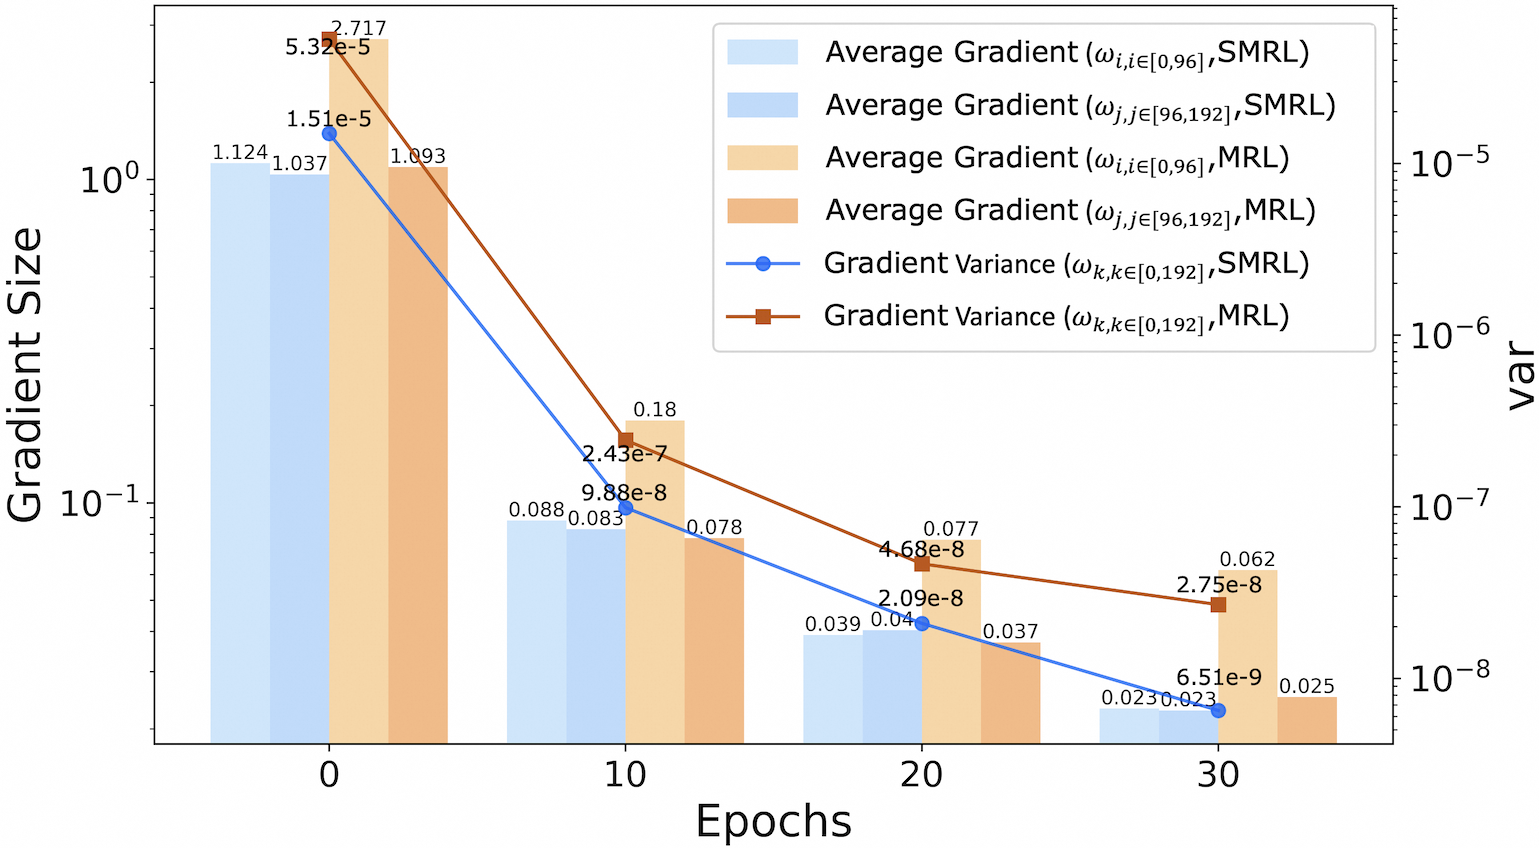
## Chart: Gradient Size and Variance vs. Epochs
### Overview
The image is a combination bar and line chart that displays the average gradient and gradient variance for two different models (SMRL and MRL) across several epochs. The y-axis on the left represents "Gradient Size" on a logarithmic scale, while the y-axis on the right represents "var" (variance) also on a logarithmic scale. The x-axis represents "Epochs".
### Components/Axes
* **X-axis:** Epochs, with tick marks at 0, 10, 20, and 30.
* **Left Y-axis:** Gradient Size, logarithmic scale from 10^-1 to 10^0 (1).
* **Right Y-axis:** var (variance), logarithmic scale from 10^-8 to 10^-5.
* **Legend (top-right):**
* Light Blue: Average Gradient (ω<sub>i,i∈[0,96]</sub>, SMRL)
* Blue: Average Gradient (ω<sub>j,j∈[96,192]</sub>, SMRL)
* Light Orange: Average Gradient (ω<sub>i,i∈[0,96]</sub>, MRL)
* Orange: Average Gradient (ω<sub>j,j∈[96,192]</sub>, MRL)
* Blue Line with Circle Markers: Gradient Variance (ω<sub>k,k∈[0,192]</sub>, SMRL)
* Brown Line with Square Markers: Gradient Variance (ω<sub>k,k∈[0,192]</sub>, MRL)
### Detailed Analysis
**Average Gradient (Bar Plots):**
* **SMRL (ω<sub>i,i∈[0,96]</sub>, Light Blue):**
* Epoch 0: 1.124
* Epoch 10: 0.088
* Epoch 20: 0.039
* Epoch 30: 0.023
* **SMRL (ω<sub>j,j∈[96,192]</sub>, Blue):**
* Epoch 0: 1.037
* Epoch 10: 0.083
* Epoch 20: 0.04
* Epoch 30: 0.023
* **MRL (ω<sub>i,i∈[0,96]</sub>, Light Orange):**
* Epoch 0: 1.51e-5
* Epoch 10: 2.43e-7
* Epoch 20: 4.68e-8
* Epoch 30: 6.51e-9
* **MRL (ω<sub>j,j∈[96,192]</sub>, Orange):**
* Epoch 0: 1.093
* Epoch 10: 0.18
* Epoch 20: 0.077
* Epoch 30: 0.062
**Gradient Variance (Line Plots):**
* **SMRL (ω<sub>k,k∈[0,192]</sub>, Blue Line):** The line slopes downward.
* Epoch 0: 1.51e-5
* Epoch 10: 9.88e-8
* Epoch 20: 2.09e-8
* Epoch 30: 6.51e-9
* **MRL (ω<sub>k,k∈[0,192]</sub>, Brown Line):** The line slopes downward.
* Epoch 0: 5.32e-5
* Epoch 10: 2.717
* Epoch 20: 2.43e-7
* Epoch 30: 4.68e-8
### Key Observations
* Both average gradients (SMRL and MRL) decrease as the number of epochs increases.
* Both gradient variances (SMRL and MRL) decrease as the number of epochs increases.
* The SMRL average gradients are significantly larger than the MRL average gradients.
* The SMRL gradient variance is initially lower than the MRL gradient variance, but both converge to similar values at higher epochs.
### Interpretation
The chart illustrates the training behavior of two models, SMRL and MRL, by tracking the average gradient and gradient variance over epochs. The decreasing gradient size suggests that both models are learning and converging towards a minimum. The decreasing gradient variance indicates that the models are becoming more stable and consistent in their updates. The SMRL model has larger average gradients, which could indicate faster initial learning, but the MRL model's lower initial variance might suggest better stability. The convergence of both models' variances at higher epochs implies that they eventually reach a similar level of stability.