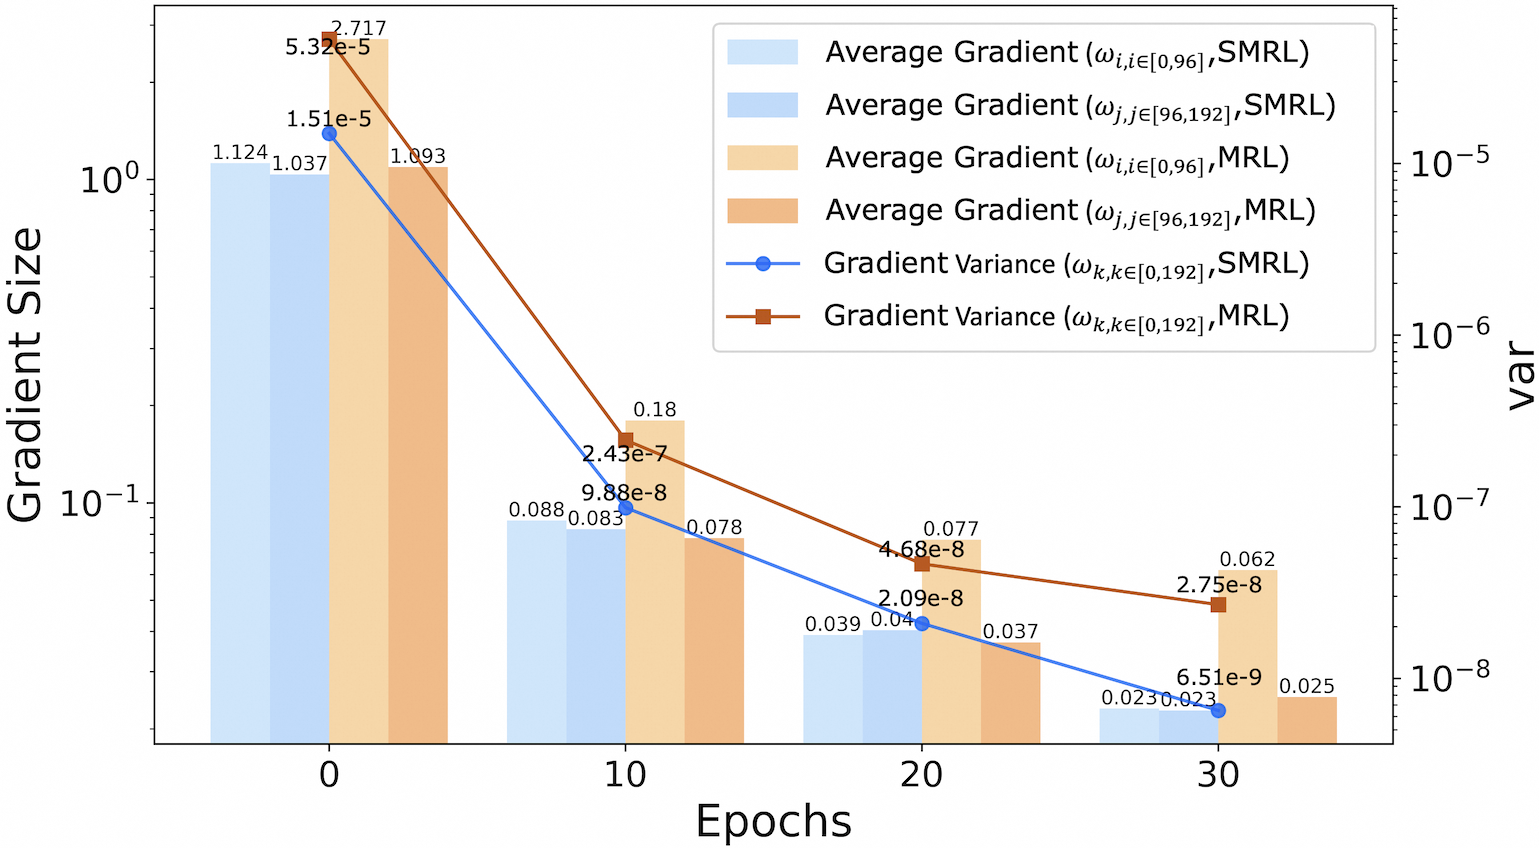
## Chart: Gradient Size and Variance Across Epochs for SMRL and MRL Methods
### Overview
This is a dual-axis chart combining a grouped bar chart and two line plots. It visualizes the evolution of gradient statistics (average size and variance) over training epochs for two different methods: SMRL and MRL. The chart uses a logarithmic scale for both y-axes to accommodate the wide range of values.
### Components/Axes
* **X-Axis (Bottom):** Labeled "Epochs". Major tick marks and labels are at 0, 10, 20, and 30.
* **Primary Y-Axis (Left):** Labeled "Gradient Size". It is a logarithmic scale ranging from below 10⁻¹ to above 10⁰.
* **Secondary Y-Axis (Right):** Labeled "var" (presumably variance). It is a logarithmic scale ranging from 10⁻⁸ to 10⁻⁵.
* **Legend (Top-Right Corner):** Contains six entries, differentiating data series by color and marker:
1. Light Blue Bar: `Average Gradient (ω_i, i∈[0,96], SMRL)`
2. Medium Blue Bar: `Average Gradient (ω_j, j∈[96,192], SMRL)`
3. Light Orange Bar: `Average Gradient (ω_i, i∈[0,96], MRL)`
4. Dark Orange Bar: `Average Gradient (ω_j, j∈[96,192], MRL)`
5. Blue Line with Circle Markers: `Gradient Variance (ω_k, k∈[0,192], SMRL)`
6. Brown Line with Square Markers: `Gradient Variance (ω_k, k∈[0,192], MRL)`
### Detailed Analysis
**Data Series and Values (by Epoch):**
* **Epoch 0:**
* **Bars (Gradient Size):**
* SMRL (ω_i, [0,96]): ~1.124
* SMRL (ω_j, [96,192]): ~1.037
* MRL (ω_i, [0,96]): ~2.717 (annotated)
* MRL (ω_j, [96,192]): ~1.093
* **Lines (Gradient Variance):**
* SMRL (Blue Circle): ~1.51e-5 (annotated)
* MRL (Brown Square): ~5.32e-5 (annotated)
* **Epoch 10:**
* **Bars (Gradient Size):**
* SMRL (ω_i, [0,96]): ~0.088
* SMRL (ω_j, [96,192]): ~0.083
* MRL (ω_i, [0,96]): ~0.18 (annotated)
* MRL (ω_j, [96,192]): ~0.078
* **Lines (Gradient Variance):**
* SMRL (Blue Circle): ~9.88e-8 (annotated)
* MRL (Brown Square): ~2.43e-7 (annotated)
* **Epoch 20:**
* **Bars (Gradient Size):**
* SMRL (ω_i, [0,96]): ~0.039
* SMRL (ω_j, [96,192]): ~0.04
* MRL (ω_i, [0,96]): ~0.077 (annotated)
* MRL (ω_j, [96,192]): ~0.037
* **Lines (Gradient Variance):**
* SMRL (Blue Circle): ~2.09e-8 (annotated)
* MRL (Brown Square): ~4.68e-8 (annotated)
* **Epoch 30:**
* **Bars (Gradient Size):**
* SMRL (ω_i, [0,96]): ~0.023
* SMRL (ω_j, [96,192]): ~0.023
* MRL (ω_i, [0,96]): ~0.062 (annotated)
* MRL (ω_j, [96,192]): ~0.025
* **Lines (Gradient Variance):**
* SMRL (Blue Circle): ~6.51e-9 (annotated)
* MRL (Brown Square): ~2.75e-8 (annotated)
### Key Observations
1. **Consistent Downward Trend:** All six data series (four bar categories and two line plots) show a clear, monotonic decrease from Epoch 0 to Epoch 30. This indicates that both the magnitude of the gradients and their variance diminish as training progresses.
2. **Method Comparison (MRL vs. SMRL):**
* **Gradient Size:** At every epoch, the average gradient for the `ω_i` parameter subset (first 96 parameters) is significantly larger for MRL than for SMRL. The difference is most pronounced at Epoch 0 (2.717 vs. 1.124) and narrows but persists through Epoch 30 (0.062 vs. 0.023). For the `ω_j` subset (parameters 96-192), the sizes are much closer between methods.
* **Gradient Variance:** The variance for MRL (brown line) is consistently higher than for SMRL (blue line) at all measured epochs. The gap is largest at Epoch 0 and decreases over time.
3. **Parameter Subset Differences:** Within each method, the gradient size for the `ω_i` subset is generally larger than for the `ω_j` subset, especially for MRL in early epochs.
### Interpretation
This chart provides a technical comparison of optimization dynamics between two methods, likely in a machine learning context. The data suggests:
* **Training Progress:** The universal decrease in gradient size and variance is a classic sign of model convergence. As the model parameters approach an optimal point, the updates (gradients) become smaller and more consistent.
* **Method Behavior:** The MRL method exhibits larger gradients and higher gradient variance, particularly in the early stages of training (Epoch 0). This could imply that MRL takes more aggressive or exploratory steps initially. The SMRL method shows more conservative, lower-variance updates from the start.
* **Parameter Sensitivity:** The difference in gradient sizes between the `ω_i` and `ω_j` subsets indicates that the model's parameters are not updated uniformly. The first 96 parameters (`ω_i`) appear to be more active or sensitive, especially under the MRL method. This could reflect the model's architecture or the nature of the learning task.
* **Convergence Pattern:** While both methods show convergence, SMRL converges to a state with lower gradient variance. Whether this leads to a better or worse final model performance cannot be determined from this chart alone; it would require corresponding loss or accuracy metrics. The chart effectively visualizes the *process* of optimization for each method.