## Bar Chart with Line Overlays: Gradient Size and Variance Across Epochs
### Overview
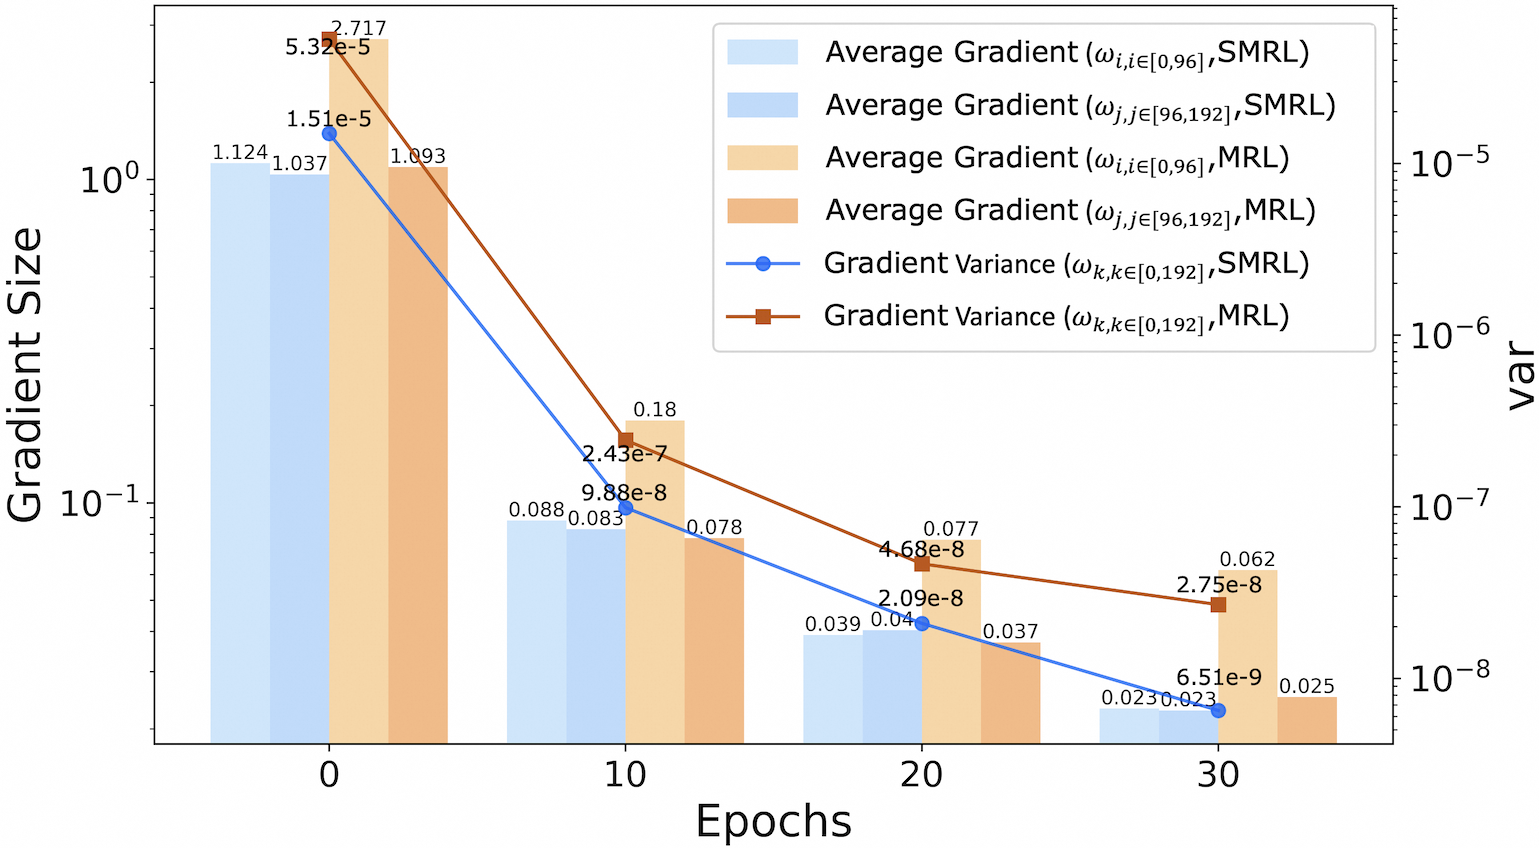
The chart visualizes gradient size and variance across four training epochs (0, 10, 20, 30) for different parameter ranges and methods (SMRL vs. MRL). It uses dual y-axes: left for gradient size (log scale) and right for gradient variance (log scale). Four bar categories and two line series are plotted, with distinct color coding for clarity.
### Components/Axes
- **X-axis**: Epochs (0, 10, 20, 30)
- **Left Y-axis**: Gradient Size (log scale, 10⁻¹ to 10⁰)
- **Right Y-axis**: Gradient Variance (log scale, 10⁻⁸ to 10⁻⁵)
- **Legend**:
- Light Blue: Average Gradient (ωᵢ,ᵢ∈[0,96], SMRL)
- Dark Blue: Average Gradient (ωⱼ,ⱼ∈[96,192], SMRL)
- Light Orange: Average Gradient (ωᵢ,ᵢ∈[0,96], MRL)
- Dark Orange: Average Gradient (ωⱼ,ⱼ∈[96,192], MRL)
- Blue Circle: Gradient Variance (ωₖ,ₖ∈[0,192], SMRL)
- Red Square: Gradient Variance (ωₖ,ₖ∈[0,192], MRL)
### Detailed Analysis
#### Bars (Gradient Size)
- **Epoch 0**:
- Light Blue: 1.124
- Dark Blue: 1.037
- Light Orange: 2.717
- Dark Orange: 1.093
- **Epoch 10**:
- Light Blue: 0.088
- Dark Blue: 0.083
- Light Orange: 0.18
- Dark Orange: 0.078
- **Epoch 20**:
- Light Blue: 0.039
- Dark Blue: 0.04
- Light Orange: 0.077
- Dark Orange: 0.037
- **Epoch 30**:
- Light Blue: 0.023
- Dark Blue: 0.023
- Light Orange: 0.062
- Dark Orange: 0.025
#### Lines (Gradient Variance)
- **SMRL (Blue Circle)**:
- Epoch 0: 1.51e-5
- Epoch 10: 2.43e-7
- Epoch 20: 2.09e-8
- Epoch 30: 6.51e-9
- **MRL (Red Square)**:
- Epoch 0: 5.32e-5
- Epoch 10: 9.88e-8
- Epoch 20: 4.68e-8
- Epoch 30: 2.75e-8
### Key Observations
1. **Gradient Size Decay**: All bar categories show exponential decay in gradient size over epochs. The largest initial gradient size (2.717) occurs in the light orange category (ωᵢ,ᵢ∈[0,96], MRL) at epoch 0.
2. **Variance Trends**:
- SMRL variance (blue line) starts higher than MRL (red line) but decays faster, reaching 6.51e-9 by epoch 30.
- MRL variance remains relatively stable after epoch 10, hovering around 2.75e-8.
3. **Parameter Range Differences**:
- The [0,96] range (light blue/orange bars) consistently has higher gradient sizes than [96,192] (dark blue/orange bars).
- Variance for [0,192] (blue/red lines) dominates over sub-range variances.
### Interpretation
The data demonstrates that gradient magnitudes and variances decrease with training epochs, indicating convergence. MRL exhibits more stable gradients (lower variance) compared to SMRL, particularly in later epochs. The [0,96] parameter range dominates in initial gradient magnitude but decays faster than [96,192]. The dual-axis visualization highlights the inverse relationship between gradient size and variance: as gradients shrink, their relative variability diminishes. This suggests MRL may be more robust for large-scale parameter optimization, while SMRL shows higher early variability but stabilizes more effectively over time.