## Violin Plot: Goedel-Prover-SFT Distribution Comparison
### Overview
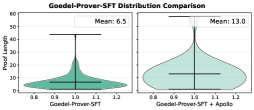
The image presents a side-by-side violin plot comparing the distribution of "Proof Length" for two scenarios: "Goedel-Prover-SFT" and "Goedel-Prover-SFT + Apollo". The plots visually represent the probability density of the proof lengths for each scenario, with overlaid horizontal lines indicating the mean values.
### Components/Axes
* **Title:** Goedel-Prover-SFT Distribution Comparison
* **Y-axis:** Proof Length (numerical scale from 0 to 60, with tick marks at 0, 10, 20, 30, 40, 50, and 60)
* **X-axis (Left Plot):** Goedel-Prover-SFT (numerical scale from 0.8 to 1.2, with tick marks at 0.8, 0.9, 1.0, 1.1, and 1.2)
* **X-axis (Right Plot):** Goedel-Prover-SFT + Apollo (numerical scale from 0.8 to 1.2, with tick marks at 0.8, 0.9, 1.0, 1.1, and 1.2)
* **Violin Plot Color:** Light teal
### Detailed Analysis
**Left Plot: Goedel-Prover-SFT**
* The violin plot is centered around x=1.0.
* The distribution is skewed right.
* The mean proof length is 6.5.
* The minimum proof length is approximately 0.
* The maximum proof length is approximately 44.
* The interquartile range appears to be between approximately 3 and 10.
**Right Plot: Goedel-Prover-SFT + Apollo**
* The violin plot is centered around x=1.0.
* The distribution is skewed right.
* The mean proof length is 13.0.
* The minimum proof length is approximately 0.
* The maximum proof length is approximately 58.
* The interquartile range appears to be between approximately 5 and 20.
### Key Observations
* The addition of "Apollo" to "Goedel-Prover-SFT" significantly increases the mean proof length.
* The distribution of proof lengths is more spread out with the addition of "Apollo".
* Both distributions are skewed right, indicating a higher probability of shorter proof lengths.
### Interpretation
The violin plots illustrate the impact of adding "Apollo" to the "Goedel-Prover-SFT" system on the distribution of proof lengths. The increase in mean proof length and the wider distribution suggest that "Apollo" introduces more variability and, on average, longer proofs. This could be due to "Apollo" exploring a wider range of proof strategies or introducing more complex reasoning steps. The right skew in both distributions suggests that shorter proofs are more common, but the addition of "Apollo" increases the likelihood of encountering longer proofs.