## Violin Plot: Goedel-Prover-SFT Distribution Comparison
### Overview
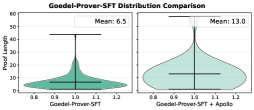
The image displays two side-by-side violin plots comparing the statistical distribution of "Proof Length" between two different system configurations: a baseline "Goedel-Prover-SFT" and an augmented "Goedel-Prover-SFT + Apollo". The charts illustrate how the addition of "Apollo" alters the length and variance of the generated proofs.
### Components/Axes
**Header (Top Center):**
* **Main Title:** "Goedel-Prover-SFT Distribution Comparison" (Black, bold text).
**Y-Axis (Shared visually, labeled on the far left):**
* **Title:** "Proof Length" (Rotated 90 degrees counter-clockwise).
* **Scale/Markers:** Ranges from 0 to 60, with tick marks and faint horizontal grid lines at intervals of 10 (0, 10, 20, 30, 40, 50, 60).
**Left Subplot (Baseline):**
* **X-Axis Label (Bottom Center):** "Goedel-Prover-SFT"
* **X-Axis Scale:** 0.8, 0.9, 1.0, 1.1, 1.2 (Note: In standard violin plots, these are dummy coordinates used to define the width of the plot around a central axis of 1.0; they do not represent data variables).
* **Legend (Top Right):** A white box containing the text "Mean: 6.5".
**Right Subplot (Augmented):**
* **X-Axis Label (Bottom Center):** "Goedel-Prover-SFT + Apollo"
* **X-Axis Scale:** 0.8, 0.9, 1.0, 1.1, 1.2 (Dummy coordinates).
* **Legend (Top Right):** A white box containing the text "Mean: 13.0".
### Detailed Analysis
**1. Left Plot: Goedel-Prover-SFT**
* **Visual Trend:** The distribution is highly skewed to the right (positive skew). The vast majority of the data mass is concentrated at the very bottom of the y-axis, indicating that most proofs are quite short. The plot narrows sharply and extends into a long, thin upper tail.
* **Color:** Medium teal/sea-green fill with a dark outline.
* **Data Points (Approximate based on visual alignment with Y-axis):**
* **Minimum (Bottom horizontal line):** ~1
* **Mean/Median (Middle horizontal line):** 6.5 (Explicitly stated in the legend). Visually, the widest part of the violin (the mode) sits slightly below this mean line, around 4-5.
* **Maximum (Top horizontal line):** ~44
**2. Right Plot: Goedel-Prover-SFT + Apollo**
* **Visual Trend:** While still exhibiting a rightward skew, the distribution is significantly more dispersed than the baseline. The "bulb" of the violin is wider, taller, and sits higher on the y-axis. The tail extends much further up the y-axis, indicating a higher frequency of much longer proofs.
* **Color:** Pale mint green/light cyan fill with a dark outline.
* **Data Points (Approximate based on visual alignment with Y-axis):**
* **Minimum (Bottom horizontal line):** ~1
* **Mean/Median (Middle horizontal line):** 13.0 (Explicitly stated in the legend). The widest part of the violin sits around 10-12.
* **Maximum (Top horizontal line):** ~58
### Key Observations
* **Mean Doubling:** The most prominent data point is the exact doubling of the mean proof length, from 6.5 in the baseline to 13.0 with the addition of Apollo.
* **Maximum Extension:** The maximum proof length increases by approximately 14 units (from ~44 to ~58).
* **Variance/Spread:** The right plot is visibly "fatter" in the middle ranges (10-30) compared to the left plot, which is almost entirely concentrated below 10. This indicates a much higher variance in proof lengths when Apollo is used.
* **Shared Minimums:** Both distributions appear to share a similar minimum proof length near zero (approx. 1), suggesting that Apollo does not eliminate short proofs entirely, but rather shifts the overall distribution upward.
### Interpretation
The data clearly demonstrates that integrating "Apollo" into the "Goedel-Prover-SFT" system fundamentally changes the output characteristics of the model, specifically regarding verbosity or complexity.
Because "Proof Length" in automated theorem proving or logical reasoning models usually correlates with the number of deductive steps or the depth of reasoning, the doubling of the mean suggests that Apollo enables or forces the model to generate significantly more detailed, multi-step proofs.
*Reading between the lines (Peircean inference):* The fact that the minimum proof length remains unchanged while the mean and maximum increase drastically implies that Apollo does not simply add "padding" to all answers. If a proof requires only 1 or 2 steps, the Apollo-augmented model can still provide that short answer. However, for more complex problems, Apollo unlocks the model's ability to sustain longer chains of reasoning (up to ~58 steps/length units), whereas the baseline model rarely exceeded 10 steps and capped out at ~44. Therefore, Apollo likely acts as a reasoning enhancer or a search-depth expander rather than a simple verbosity multiplier.