\n
## Violin Plot: Goedel-Prover-SFT Distribution Comparison
### Overview
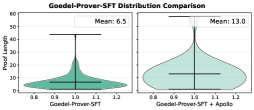
The image presents a side-by-side comparison of two violin plots, visualizing the distribution of "Proof Length" for two different conditions: "Goedel-Prover-SFT" and "Goedel-Prover-SFT + Apollo". Each plot also displays a horizontal line indicating the mean value.
### Components/Axes
* **Title:** "Goedel-Prover-SFT Distribution Comparison" (centered at the top)
* **X-axis:** Labels "Goedel-Prover-SFT" (left plot) and "Goedel-Prover-SFT + Apollo" (right plot). The scale ranges approximately from 0.8 to 1.2.
* **Y-axis:** Label "Proof Length". The scale ranges from approximately 0 to 60.
* **Violin Plots:** Two violin plots, one for each condition. The width of each violin represents the density of the data at different proof lengths.
* **Mean Indicators:** Horizontal lines within each violin plot, indicating the mean proof length.
* **Mean Labels:** "Mean: 6.5" (above the left plot) and "Mean: 13.0" (above the right plot).
### Detailed Analysis
**Left Plot (Goedel-Prover-SFT):**
The violin plot is centered around a value of approximately 1.0 on the x-axis. The shape is relatively narrow, indicating a tighter distribution of proof lengths. The violin plot extends from approximately 0.8 to 1.2 on the x-axis. The mean line is positioned at approximately 1.0, with a value of 6.5 on the y-axis. The plot shows a concentration of data between 5 and 15 on the y-axis.
**Right Plot (Goedel-Prover-SFT + Apollo):**
The violin plot is also centered around a value of approximately 1.0 on the x-axis. However, this violin is wider than the left one, suggesting a more dispersed distribution of proof lengths. The violin plot extends from approximately 0.8 to 1.2 on the x-axis. The mean line is positioned at approximately 1.0, with a value of 13.0 on the y-axis. The plot shows a concentration of data between 5 and 25 on the y-axis.
### Key Observations
* The "Goedel-Prover-SFT + Apollo" condition has a significantly higher mean proof length (13.0) compared to the "Goedel-Prover-SFT" condition (6.5).
* The distribution of proof lengths is more spread out in the "Goedel-Prover-SFT + Apollo" condition, as indicated by the wider violin plot.
* Both distributions appear roughly symmetrical around their respective means.
### Interpretation
The data suggests that adding "Apollo" to "Goedel-Prover-SFT" results in longer proofs, on average. The wider distribution for the combined condition indicates that the impact of "Apollo" on proof length is more variable. This could mean that "Apollo" sometimes leads to significantly longer proofs, while in other cases, the effect is less pronounced. The violin plots provide a visual representation of the distribution of proof lengths, allowing for a comparison of the central tendency and spread of the data for each condition. The difference in means is substantial, suggesting a meaningful effect of "Apollo" on proof length. The symmetry of the distributions suggests that the effect of "Apollo" is not biased towards particularly short or long proofs.