## Violin Plot: Goedel-Prover-SFT Distribution Comparison
### Overview
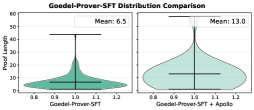
The image presents two violin plots comparing the distribution of "Proof Length" for two configurations: "Goedel-Prover-SFT" (left) and "Goedel-Prover-SFT + Apollo" (right). The plots visualize the density and variability of proof lengths, with annotated mean values.
### Components/Axes
- **Title**: "Goedel-Prover-SFT Distribution Comparison"
- **X-axis**: Labeled "Goedel-Prover-SFT" (left plot) and "Goedel-Prover-SFT + Apollo" (right plot).
- **Y-axis**: Labeled "Proof Length" (both plots), with a range from 0 to 60.
- **Legend**: Not explicitly visible; group distinctions are inferred from plot titles.
- **Color**:
- Left plot: Teal (dark green).
- Right plot: Light blue (cyan).
### Detailed Analysis
- **Left Plot (Goedel-Prover-SFT)**:
- **Mean**: 6.5 (annotated in the top-right corner).
- **Distribution**: Narrow and concentrated around the mean, with a peak near 1.0 on the x-axis.
- **Range**: Proof lengths cluster tightly between ~0.8 and 1.2 on the x-axis, with a long tail extending to ~40 on the y-axis.
- **Right Plot (Goedel-Prover-SFT + Apollo)**:
- **Mean**: 13.0 (annotated in the top-right corner).
- **Distribution**: Wider and more spread out, with a peak near 1.0 on the x-axis but a broader range.
- **Range**: Proof lengths extend from ~0.8 to 1.2 on the x-axis, with a taller tail reaching ~60 on the y-axis.
### Key Observations
1. **Mean Difference**: The right plot’s mean (13.0) is double the left plot’s mean (6.5), indicating a significant increase in average proof length when Apollo is added.
2. **Distribution Shape**:
- The left plot shows a unimodal, narrow distribution, suggesting consistent proof lengths.
- The right plot exhibits a bimodal or multimodal distribution, with a broader spread and higher variability.
3. **Tail Behavior**: The right plot’s tail extends further along the y-axis, indicating a higher frequency of longer proofs.
### Interpretation
The data suggests that adding Apollo to the Goedel-Prover-SFT system increases both the average proof length and the variability of proof lengths. This could imply that Apollo introduces complexity or additional constraints, leading to longer and more diverse proofs. The narrower distribution in the left plot highlights the stability of the base system, while the right plot’s wider spread may reflect trade-offs between performance and efficiency. The absence of a legend necessitates relying on plot titles for group identification, which aligns with the spatial positioning of the data.