## Line Chart: R1-Llama | GPQA-D Accuracy vs. Ratio
### Overview
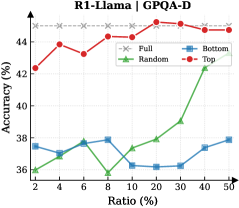
This line chart displays the accuracy of different sampling methods (Full, Random, Bottom, Top) for the R1-Llama model on the GPQA-D dataset, as a function of the ratio of samples used. The x-axis represents the ratio (in percentage), and the y-axis represents the accuracy (in percentage).
### Components/Axes
* **Title:** R1-Llama | GPQA-D
* **X-axis Label:** Ratio (%)
* **Y-axis Label:** Accuracy (%)
* **Legend:**
* Full (Grey 'x' markers)
* Random (Green triangle markers)
* Bottom (Blue triangle markers)
* Top (Red circle markers)
* **X-axis Markers:** 2, 4, 6, 8, 10, 20, 30, 40, 50
* **Y-axis Scale:** Approximately 36 to 46 (percentage)
### Detailed Analysis
The chart shows four lines representing the accuracy of each sampling method as the ratio increases.
* **Full (Grey):** The line is relatively flat, hovering around approximately 44.5% accuracy across all ratios.
* (2, 44.5)
* (4, 44.5)
* (6, 44.5)
* (8, 44.5)
* (10, 44.5)
* (20, 44.5)
* (30, 44.5)
* (40, 44.5)
* (50, 44.5)
* **Random (Green):** The line starts at approximately 36.5% at a ratio of 2, decreases to a minimum of around 35.5% at a ratio of 8, and then increases steadily to approximately 42.5% at a ratio of 40.
* (2, 36.5)
* (4, 37.5)
* (6, 38.0)
* (8, 35.5)
* (10, 37.0)
* (20, 39.0)
* (30, 40.5)
* (40, 42.5)
* (50, ~38.0)
* **Bottom (Blue):** The line fluctuates between approximately 37% and 38.5% with no clear trend.
* (2, 37.5)
* (4, 37.0)
* (6, 38.0)
* (8, 37.0)
* (10, 36.5)
* (20, 37.0)
* (30, 37.0)
* (40, 38.0)
* (50, 38.0)
* **Top (Red):** The line starts at approximately 42.5% at a ratio of 2, increases to a peak of approximately 45% at a ratio of 20, and then decreases slightly to approximately 44.5% at a ratio of 50.
* (2, 42.5)
* (4, 43.5)
* (6, 44.0)
* (8, 44.5)
* (10, 44.5)
* (20, 45.0)
* (30, 44.8)
* (40, 44.5)
* (50, 44.5)
### Key Observations
* The "Full" sampling method maintains a consistently high accuracy across all ratios.
* The "Top" sampling method shows the highest accuracy at a ratio of 20%.
* The "Random" sampling method demonstrates a significant increase in accuracy as the ratio increases, starting from a lower baseline.
* The "Bottom" sampling method exhibits the least variation in accuracy.
### Interpretation
The data suggests that using all available samples ("Full") provides a stable and reasonably high level of accuracy. However, the "Top" sampling method can achieve even higher accuracy, particularly when using around 20% of the samples. The "Random" method shows that increasing the sample ratio can improve accuracy, but it starts from a lower point than the other methods. The "Bottom" method appears to be the least effective, with consistently lower and more stable accuracy.
The relationship between the sampling methods and accuracy likely reflects the distribution of information within the dataset. The "Top" method may be identifying the most relevant samples, leading to higher accuracy at certain ratios. The "Random" method's improvement with ratio suggests that more samples generally lead to better results, but the randomness introduces variability. The "Full" method's stability indicates that all samples contribute to a consistent level of performance. The "Bottom" method's poor performance suggests that the least relevant samples are detrimental to accuracy. The peak at 20% for the "Top" method could indicate a sweet spot where the most informative samples are captured without including too much noise.