## Line Chart: R1-Llama | GPQA-D
### Overview
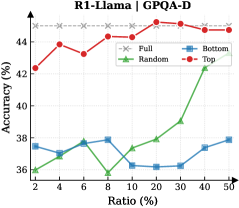
The chart illustrates the relationship between "Ratio (%)" (x-axis) and "Accuracy (%)" (y-axis) across four distinct data series. The y-axis ranges from 36% to 44%, while the x-axis spans 2% to 50%. Four lines represent different conditions: "Full" (gray dashed), "Bottom" (blue solid), "Random" (green solid), and "Top" (red solid). Key trends include a sharp rise in the "Random" series at higher ratios and stability in the "Top" series.
### Components/Axes
- **X-axis**: "Ratio (%)" (2% to 50%, increments of 2%).
- **Y-axis**: "Accuracy (%)" (36% to 44%, increments of 2%).
- **Legend**:
- Gray dashed line: "Full"
- Blue solid line: "Bottom"
- Green solid line: "Random"
- Red solid line: "Top"
- **Placement**: Legend is centered-right; axes are labeled with clear titles.
### Detailed Analysis
1. **Top (Red Solid Line)**:
- Starts at ~42% at 2%.
- Peaks at ~44% by 10%, then fluctuates between 43.5%–44%.
- Remains stable above 43% for ratios ≥10%.
2. **Random (Green Solid Line)**:
- Begins at ~36% at 2%.
- Dips to ~35.5% at 8%.
- Sharp upward trend from 30% (37%) to 40% (42%).
- Ends at ~42% at 50%.
3. **Bottom (Blue Solid Line)**:
- Stays between 36%–38% across all ratios.
- Minor fluctuations (e.g., 37.5% at 2%, 36.5% at 8%).
4. **Full (Gray Dashed Line)**:
- Horizontal line at ~44% across all ratios.
### Key Observations
- The "Top" series maintains the highest accuracy, closely tracking the "Full" line.
- The "Random" series exhibits a significant accuracy jump at ratios ≥30%, surpassing the "Bottom" series.
- The "Bottom" series remains consistently the lowest performer.
- The "Full" line acts as a ceiling, suggesting maximum achievable accuracy.
### Interpretation
The chart demonstrates that the "Top" condition achieves near-optimal accuracy (44%), aligning with the "Full" condition. The "Random" series's sharp rise at higher ratios suggests a threshold effect, where increased ratio values unlock higher performance. The "Bottom" series's stability implies it represents a baseline or control group. The "Full" line's flat trajectory indicates it may represent a theoretical maximum or reference point. The divergence between "Random" and "Top" at lower ratios highlights the importance of structured conditions for optimal performance.