TECHNICAL ASSET FINGERPRINT
99cd19c61544fdb0df9c1ed4
Click to view fullscreen
Press ESC or click to close
FOUND IN PAPERS
EXPERT: gemini-2.0-flash VERSION 1
RUNTIME: nugit/gemini/gemini-2.0-flash
INTEL_VERIFIED
## Chart: Model Accuracy vs. Model Size
### Overview
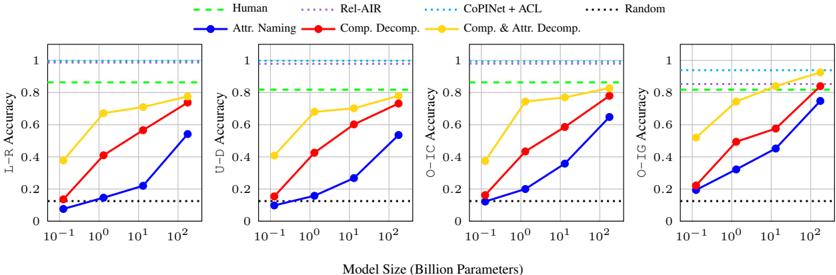
The image contains four line charts comparing the accuracy of different models against model size (in Billion Parameters). The charts compare "Attribute Naming", "Compositional Decomposition", and "Compositional & Attribute Decomposition" models, along with baselines for "Human", "Rel-AIR", "CoPiNet + ACL", and "Random". The four charts represent different tasks or datasets, labeled as "L-R", "U-D", "O-IC", and "O-IG".
### Components/Axes
* **X-axis:** Model Size (Billion Parameters). Logarithmic scale with markers at 10<sup>-1</sup>, 10<sup>0</sup>, 10<sup>1</sup>, and 10<sup>2</sup>.
* **Y-axis:** Accuracy, ranging from 0 to 1.
* **Chart Titles (Y-axis labels):**
* Leftmost Chart: L-R Accuracy
* Second Chart: U-D Accuracy
* Third Chart: O-IC Accuracy
* Rightmost Chart: O-IG Accuracy
* **Legend (Top of image):**
* Green dashed line: Human
* Blue solid line with circles: Attr. Naming
* Red solid line with circles: Comp. Decomp.
* Yellow solid line with circles: Comp. & Attr. Decomp.
* Light Blue dotted line: CoPiNet + ACL
* Black dotted line: Random
### Detailed Analysis
**Chart 1: L-R Accuracy**
* **Human (Green dashed line):** Constant accuracy at approximately 0.85.
* **Rel-AIR (Light Blue dotted line):** Constant accuracy at approximately 1.0.
* **Attr. Naming (Blue solid line):** Accuracy increases with model size.
* 10<sup>-1</sup>: ~0.1
* 10<sup>0</sup>: ~0.15
* 10<sup>1</sup>: ~0.22
* 10<sup>2</sup>: ~0.55
* **Comp. Decomp. (Red solid line):** Accuracy increases with model size.
* 10<sup>-1</sup>: ~0.12
* 10<sup>0</sup>: ~0.42
* 10<sup>1</sup>: ~0.57
* 10<sup>2</sup>: ~0.76
* **Comp. & Attr. Decomp. (Yellow solid line):** Accuracy increases with model size.
* 10<sup>-1</sup>: ~0.38
* 10<sup>0</sup>: ~0.68
* 10<sup>1</sup>: ~0.72
* 10<sup>2</sup>: ~0.78
* **Random (Black dotted line):** Constant accuracy at approximately 0.13.
**Chart 2: U-D Accuracy**
* **Human (Green dashed line):** Constant accuracy at approximately 0.82.
* **Rel-AIR (Light Blue dotted line):** Constant accuracy at approximately 1.0.
* **Attr. Naming (Blue solid line):** Accuracy increases with model size.
* 10<sup>-1</sup>: ~0.12
* 10<sup>0</sup>: ~0.13
* 10<sup>1</sup>: ~0.28
* 10<sup>2</sup>: ~0.54
* **Comp. Decomp. (Red solid line):** Accuracy increases with model size.
* 10<sup>-1</sup>: ~0.12
* 10<sup>0</sup>: ~0.43
* 10<sup>1</sup>: ~0.63
* 10<sup>2</sup>: ~0.76
* **Comp. & Attr. Decomp. (Yellow solid line):** Accuracy increases with model size.
* 10<sup>-1</sup>: ~0.42
* 10<sup>0</sup>: ~0.70
* 10<sup>1</sup>: ~0.73
* 10<sup>2</sup>: ~0.78
* **Random (Black dotted line):** Constant accuracy at approximately 0.13.
**Chart 3: O-IC Accuracy**
* **Human (Green dashed line):** Constant accuracy at approximately 0.82.
* **Rel-AIR (Light Blue dotted line):** Constant accuracy at approximately 1.0.
* **Attr. Naming (Blue solid line):** Accuracy increases with model size.
* 10<sup>-1</sup>: ~0.13
* 10<sup>0</sup>: ~0.20
* 10<sup>1</sup>: ~0.35
* 10<sup>2</sup>: ~0.65
* **Comp. Decomp. (Red solid line):** Accuracy increases with model size.
* 10<sup>-1</sup>: ~0.13
* 10<sup>0</sup>: ~0.44
* 10<sup>1</sup>: ~0.62
* 10<sup>2</sup>: ~0.82
* **Comp. & Attr. Decomp. (Yellow solid line):** Accuracy increases with model size.
* 10<sup>-1</sup>: ~0.40
* 10<sup>0</sup>: ~0.75
* 10<sup>1</sup>: ~0.80
* 10<sup>2</sup>: ~0.85
* **Random (Black dotted line):** Constant accuracy at approximately 0.13.
**Chart 4: O-IG Accuracy**
* **Human (Green dashed line):** Constant accuracy at approximately 0.82.
* **Rel-AIR (Light Blue dotted line):** Constant accuracy at approximately 0.95.
* **Attr. Naming (Blue solid line):** Accuracy increases with model size.
* 10<sup>-1</sup>: ~0.20
* 10<sup>0</sup>: ~0.30
* 10<sup>1</sup>: ~0.45
* 10<sup>2</sup>: ~0.75
* **Comp. Decomp. (Red solid line):** Accuracy increases with model size.
* 10<sup>-1</sup>: ~0.22
* 10<sup>0</sup>: ~0.50
* 10<sup>1</sup>: ~0.57
* 10<sup>2</sup>: ~0.85
* **Comp. & Attr. Decomp. (Yellow solid line):** Accuracy increases with model size.
* 10<sup>-1</sup>: ~0.53
* 10<sup>0</sup>: ~0.73
* 10<sup>1</sup>: ~0.78
* 10<sup>2</sup>: ~0.90
* **Random (Black dotted line):** Constant accuracy at approximately 0.13.
### Key Observations
* The "Human" and "Rel-AIR" baselines maintain constant accuracy across all model sizes.
* The "Random" baseline maintains constant, low accuracy across all model sizes.
* The accuracy of "Attr. Naming", "Comp. Decomp.", and "Comp. & Attr. Decomp." models generally increases with model size.
* "Comp. & Attr. Decomp." generally outperforms "Comp. Decomp." and "Attr. Naming" across all model sizes and tasks.
* The performance gain from increasing model size diminishes as the model size increases, especially for "Comp. & Attr. Decomp.".
### Interpretation
The charts demonstrate the relationship between model size and accuracy for different model architectures on four different tasks (L-R, U-D, O-IC, O-IG). The results suggest that increasing model size generally improves accuracy, but the extent of improvement depends on the model architecture and the specific task. The "Compositional & Attribute Decomposition" model appears to be the most effective, achieving higher accuracy than the other models across all tasks and model sizes. The diminishing returns observed with increasing model size suggest that there may be a point beyond which further increases in model size do not significantly improve accuracy. The "Human" and "Rel-AIR" baselines provide a benchmark for evaluating the performance of the models, while the "Random" baseline establishes a lower bound for accuracy.
DECODING INTELLIGENCE...
EXPERT: nemotron-free VERSION 1
RUNTIME: free/nvidia/nemotron-nano-12b-v2-vl:free
INTEL_VERIFIED
## Line Graphs: Model Size vs. Accuracy Across Metrics
### Overview
The image contains four line graphs arranged in a 2x2 grid, comparing the performance of different model architectures across four accuracy metrics (L-R, U-D, O-IC, O-IG) as model size increases from 10⁻¹ to 10² billion parameters. Each graph includes multiple data series with distinct visual styles and legends.
---
### Components/Axes
#### Common Elements Across All Graphs:
- **X-axis**: Model Size (Billion Parameters)
- Logarithmic scale with ticks at 10⁻¹, 10⁰, 10¹, 10²
- Label: "Model Size (Billion Parameters)"
- **Y-axes**:
- Top-left: L-R Accuracy (0–1 scale)
- Top-right: U-D Accuracy (0–1 scale)
- Bottom-left: O-IC Accuracy (0–1 scale)
- Bottom-right: O-IG Accuracy (0–1 scale)
- **Legends**: Positioned at the top of each graph, with the following entries:
- **Human**: Green dashed line (flat across all graphs)
- **Rel-AIR**: Purple dotted line (flat across all graphs)
- **CoPINet + ACL**: Cyan dotted line (flat across all graphs)
- **Random**: Black dotted line (flat across all graphs)
- **Attr. Naming**: Blue solid line
- **Comp. Decomp.**: Red solid line
- **Comp. & Attr. Decomp.**: Yellow solid line
#### Spatial Grounding:
- Legends are aligned at the top-center of each graph.
- X-axis labels are centered at the bottom of each graph.
- Y-axis labels are rotated 90° on the left side of each graph.
---
### Detailed Analysis
#### 1. **L-R Accuracy (Top-left Graph)**
- **Human**: Flat green dashed line at ~0.8 accuracy.
- **Rel-AIR**: Flat purple dotted line at ~0.6 accuracy.
- **CoPINet + ACL**: Flat cyan dotted line at ~0.4 accuracy.
- **Random**: Flat black dotted line at ~0.2 accuracy.
- **Trends**:
- **Attr. Naming** (blue): Starts at ~0.1 (10⁻¹ params), rises to ~0.6 (10² params).
- **Comp. Decomp.** (red): Starts at ~0.2 (10⁻¹ params), rises to ~0.7 (10² params).
- **Comp. & Attr. Decomp.** (yellow): Starts at ~0.3 (10⁻¹ params), rises to ~0.75 (10² params).
#### 2. **U-D Accuracy (Top-right Graph)**
- **Human**: Flat green dashed line at ~0.8 accuracy.
- **Rel-AIR**: Flat purple dotted line at ~0.6 accuracy.
- **CoPINet + ACL**: Flat cyan dotted line at ~0.4 accuracy.
- **Random**: Flat black dotted line at ~0.2 accuracy.
- **Trends**:
- **Attr. Naming** (blue): Starts at ~0.1 (10⁻¹ params), rises to ~0.5 (10² params).
- **Comp. Decomp.** (red): Starts at ~0.2 (10⁻¹ params), rises to ~0.65 (10² params).
- **Comp. & Attr. Decomp.** (yellow): Starts at ~0.3 (10⁻¹ params), rises to ~0.7 (10² params).
#### 3. **O-IC Accuracy (Bottom-left Graph)**
- **Human**: Flat green dashed line at ~0.8 accuracy.
- **Rel-AIR**: Flat purple dotted line at ~0.6 accuracy.
- **CoPINet + ACL**: Flat cyan dotted line at ~0.4 accuracy.
- **Random**: Flat black dotted line at ~0.2 accuracy.
- **Trends**:
- **Attr. Naming** (blue): Starts at ~0.1 (10⁻¹ params), rises to ~0.55 (10² params).
- **Comp. Decomp.** (red): Starts at ~0.2 (10⁻¹ params), rises to ~0.6 (10² params).
- **Comp. & Attr. Decomp.** (yellow): Starts at ~0.3 (10⁻¹ params), rises to ~0.72 (10² params).
#### 4. **O-IG Accuracy (Bottom-right Graph)**
- **Human**: Flat green dashed line at ~0.8 accuracy.
- **Rel-AIR**: Flat purple dotted line at ~0.6 accuracy.
- **CoPINet + ACL**: Flat cyan dotted line at ~0.4 accuracy.
- **Random**: Flat black dotted line at ~0.2 accuracy.
- **Trends**:
- **Attr. Naming** (blue): Starts at ~0.1 (10⁻¹ params), rises to ~0.6 (10² params).
- **Comp. Decomp.** (red): Starts at ~0.2 (10⁻¹ params), rises to ~0.68 (10² params).
- **Comp. & Attr. Decomp.** (yellow): Starts at ~0.3 (10⁻¹ params), rises to ~0.75 (10² params).
---
### Key Observations
1. **Human Performance**: All graphs show a flat green dashed line at ~0.8 accuracy, suggesting a baseline human-level performance benchmark.
2. **Random Baseline**: The black dotted line (Random) remains consistently at ~0.2 accuracy across all metrics, indicating minimal performance without structured modeling.
3. **Model Size Correlation**: All non-baseline models (Attr. Naming, Comp. Decomp., Comp. & Attr. Decomp.) show **monotonic improvement** in accuracy as model size increases.
4. **Performance Gaps**:
- **Comp. & Attr. Decomp.** (yellow) consistently outperforms other methods across all metrics.
- **Attr. Naming** (blue) underperforms compared to decomposition-based methods.
5. **Flat Baselines**: Rel-AIR, CoPINet + ACL, and Random lines remain flat, suggesting these methods are either size-invariant or inherently limited.
---
### Interpretation
The data demonstrates that **larger model sizes correlate with improved accuracy** across all metrics, with decomposition-based methods (Comp. Decomp. and Comp. & Attr. Decomp.) achieving the highest gains. The flat lines for Human, Rel-AIR, and CoPINet + ACL imply these methods either:
- Reached a performance ceiling (Human/Rel-AIR), or
- Are not sensitive to model size changes (CoPINet + ACL).
The **Comp. & Attr. Decomp.** method (yellow) appears most effective, suggesting that combining compositional decomposition with attribute-level modeling yields superior results. The absence of overlap between data series indicates clear hierarchical performance differences, with decomposition-based approaches outperforming attribute-only methods.
**Critical Insight**: While model size drives performance gains, the choice of architectural strategy (e.g., decomposition vs. attribute naming) determines the ceiling of achievable accuracy. Human-level performance (~0.8) remains unattained by all tested methods, highlighting a potential gap in current modeling paradigms.
DECODING INTELLIGENCE...