## Line Graphs: Model Size vs. Accuracy Across Metrics
### Overview
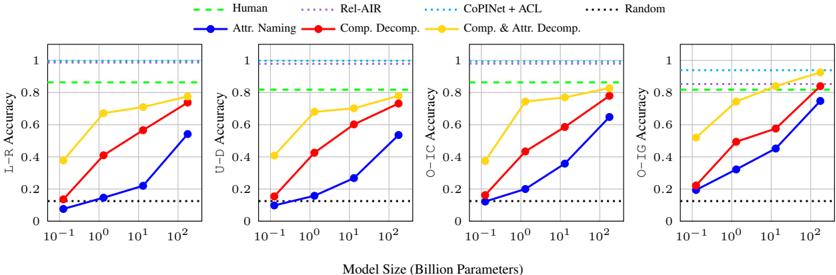
The image contains four line graphs arranged in a 2x2 grid, comparing the performance of different model architectures across four accuracy metrics (L-R, U-D, O-IC, O-IG) as model size increases from 10⁻¹ to 10² billion parameters. Each graph includes multiple data series with distinct visual styles and legends.
---
### Components/Axes
#### Common Elements Across All Graphs:
- **X-axis**: Model Size (Billion Parameters)
- Logarithmic scale with ticks at 10⁻¹, 10⁰, 10¹, 10²
- Label: "Model Size (Billion Parameters)"
- **Y-axes**:
- Top-left: L-R Accuracy (0–1 scale)
- Top-right: U-D Accuracy (0–1 scale)
- Bottom-left: O-IC Accuracy (0–1 scale)
- Bottom-right: O-IG Accuracy (0–1 scale)
- **Legends**: Positioned at the top of each graph, with the following entries:
- **Human**: Green dashed line (flat across all graphs)
- **Rel-AIR**: Purple dotted line (flat across all graphs)
- **CoPINet + ACL**: Cyan dotted line (flat across all graphs)
- **Random**: Black dotted line (flat across all graphs)
- **Attr. Naming**: Blue solid line
- **Comp. Decomp.**: Red solid line
- **Comp. & Attr. Decomp.**: Yellow solid line
#### Spatial Grounding:
- Legends are aligned at the top-center of each graph.
- X-axis labels are centered at the bottom of each graph.
- Y-axis labels are rotated 90° on the left side of each graph.
---
### Detailed Analysis
#### 1. **L-R Accuracy (Top-left Graph)**
- **Human**: Flat green dashed line at ~0.8 accuracy.
- **Rel-AIR**: Flat purple dotted line at ~0.6 accuracy.
- **CoPINet + ACL**: Flat cyan dotted line at ~0.4 accuracy.
- **Random**: Flat black dotted line at ~0.2 accuracy.
- **Trends**:
- **Attr. Naming** (blue): Starts at ~0.1 (10⁻¹ params), rises to ~0.6 (10² params).
- **Comp. Decomp.** (red): Starts at ~0.2 (10⁻¹ params), rises to ~0.7 (10² params).
- **Comp. & Attr. Decomp.** (yellow): Starts at ~0.3 (10⁻¹ params), rises to ~0.75 (10² params).
#### 2. **U-D Accuracy (Top-right Graph)**
- **Human**: Flat green dashed line at ~0.8 accuracy.
- **Rel-AIR**: Flat purple dotted line at ~0.6 accuracy.
- **CoPINet + ACL**: Flat cyan dotted line at ~0.4 accuracy.
- **Random**: Flat black dotted line at ~0.2 accuracy.
- **Trends**:
- **Attr. Naming** (blue): Starts at ~0.1 (10⁻¹ params), rises to ~0.5 (10² params).
- **Comp. Decomp.** (red): Starts at ~0.2 (10⁻¹ params), rises to ~0.65 (10² params).
- **Comp. & Attr. Decomp.** (yellow): Starts at ~0.3 (10⁻¹ params), rises to ~0.7 (10² params).
#### 3. **O-IC Accuracy (Bottom-left Graph)**
- **Human**: Flat green dashed line at ~0.8 accuracy.
- **Rel-AIR**: Flat purple dotted line at ~0.6 accuracy.
- **CoPINet + ACL**: Flat cyan dotted line at ~0.4 accuracy.
- **Random**: Flat black dotted line at ~0.2 accuracy.
- **Trends**:
- **Attr. Naming** (blue): Starts at ~0.1 (10⁻¹ params), rises to ~0.55 (10² params).
- **Comp. Decomp.** (red): Starts at ~0.2 (10⁻¹ params), rises to ~0.6 (10² params).
- **Comp. & Attr. Decomp.** (yellow): Starts at ~0.3 (10⁻¹ params), rises to ~0.72 (10² params).
#### 4. **O-IG Accuracy (Bottom-right Graph)**
- **Human**: Flat green dashed line at ~0.8 accuracy.
- **Rel-AIR**: Flat purple dotted line at ~0.6 accuracy.
- **CoPINet + ACL**: Flat cyan dotted line at ~0.4 accuracy.
- **Random**: Flat black dotted line at ~0.2 accuracy.
- **Trends**:
- **Attr. Naming** (blue): Starts at ~0.1 (10⁻¹ params), rises to ~0.6 (10² params).
- **Comp. Decomp.** (red): Starts at ~0.2 (10⁻¹ params), rises to ~0.68 (10² params).
- **Comp. & Attr. Decomp.** (yellow): Starts at ~0.3 (10⁻¹ params), rises to ~0.75 (10² params).
---
### Key Observations
1. **Human Performance**: All graphs show a flat green dashed line at ~0.8 accuracy, suggesting a baseline human-level performance benchmark.
2. **Random Baseline**: The black dotted line (Random) remains consistently at ~0.2 accuracy across all metrics, indicating minimal performance without structured modeling.
3. **Model Size Correlation**: All non-baseline models (Attr. Naming, Comp. Decomp., Comp. & Attr. Decomp.) show **monotonic improvement** in accuracy as model size increases.
4. **Performance Gaps**:
- **Comp. & Attr. Decomp.** (yellow) consistently outperforms other methods across all metrics.
- **Attr. Naming** (blue) underperforms compared to decomposition-based methods.
5. **Flat Baselines**: Rel-AIR, CoPINet + ACL, and Random lines remain flat, suggesting these methods are either size-invariant or inherently limited.
---
### Interpretation
The data demonstrates that **larger model sizes correlate with improved accuracy** across all metrics, with decomposition-based methods (Comp. Decomp. and Comp. & Attr. Decomp.) achieving the highest gains. The flat lines for Human, Rel-AIR, and CoPINet + ACL imply these methods either:
- Reached a performance ceiling (Human/Rel-AIR), or
- Are not sensitive to model size changes (CoPINet + ACL).
The **Comp. & Attr. Decomp.** method (yellow) appears most effective, suggesting that combining compositional decomposition with attribute-level modeling yields superior results. The absence of overlap between data series indicates clear hierarchical performance differences, with decomposition-based approaches outperforming attribute-only methods.
**Critical Insight**: While model size drives performance gains, the choice of architectural strategy (e.g., decomposition vs. attribute naming) determines the ceiling of achievable accuracy. Human-level performance (~0.8) remains unattained by all tested methods, highlighting a potential gap in current modeling paradigms.