## Screenshot: Chat Conversation with Volleyball Olympic Data
### Overview
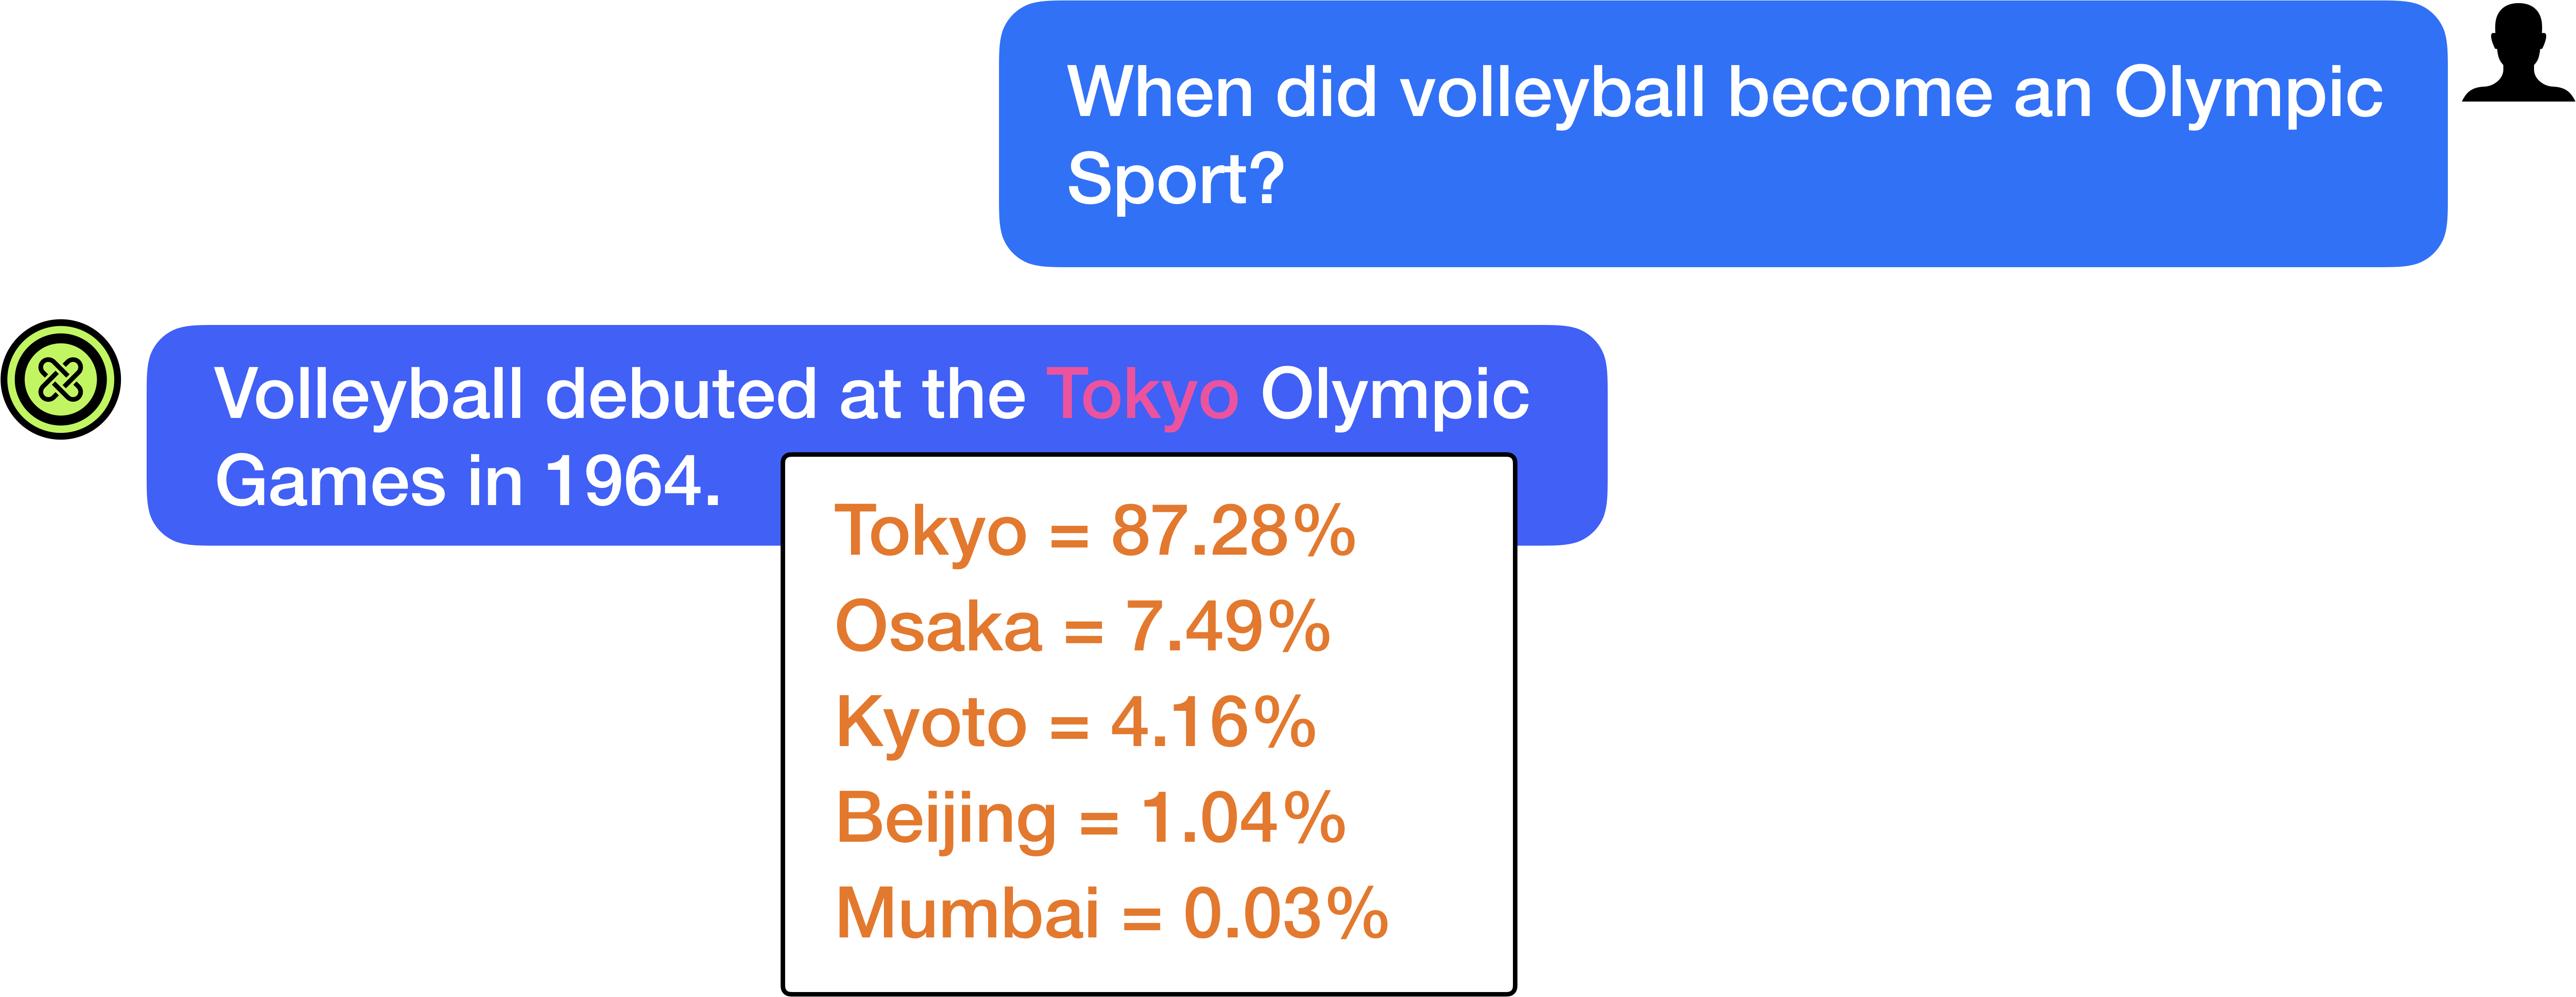
The image is a screenshot of a chat interface showing a conversation about the history of volleyball as an Olympic sport. The primary text includes a question about when volleyball became an Olympic sport, followed by a response stating its debut at the Tokyo Olympic Games in 1964. Below this, a white box with a black border lists five cities (Tokyo, Osaka, Kyoto, Beijing, Mumbai) with associated percentages in red text. The percentages appear to represent some form of distribution or ranking, though the context is unclear.
---
### Components/Axes
- **Chat Messages**:
- **Left Bubble (User)**: "When did volleyball become an Olympic Sport?"
- **Right Bubble (Assistant)**: "Volleyball debuted at the Tokyo Olympic Games in 1964."
- **Data Box**:
- **Content**: A vertical list of cities with percentages:
- Tokyo = 87.28%
- Osaka = 7.49%
- Kyoto = 4.16%
- Beijing = 1.04%
- Mumbai = 0.03%
- **Formatting**: Cities in red text, percentages in red text with two decimal places. The box has a white background and black border.
---
### Detailed Analysis
- **Chat Text**:
- The question and answer are straightforward, with no additional formatting or annotations.
- **Data Box**:
- **Structure**: Cities listed in descending order of percentage values.
- **Values**:
- Tokyo dominates with 87.28%, far exceeding other cities.
- Osaka (7.49%) and Kyoto (4.16%) follow, with Beijing (1.04%) and Mumbai (0.03%) at the lower end.
- **Uncertainty**: No explicit uncertainty markers (e.g., error bars) are present, but the precision of two decimal places suggests high confidence in the values.
---
### Key Observations
1. **Dominance of Tokyo**: Tokyo’s percentage (87.28%) is orders of magnitude higher than the next city (Osaka at 7.49%), indicating a potential outlier or unique significance.
2. **Geographic Clustering**: Four of the five cities (Tokyo, Osaka, Kyoto, Beijing) are in East Asia, while Mumbai is the only city from South Asia.
3. **Low Mumbai Value**: Mumbai’s 0.03% is the smallest value, suggesting minimal relevance in the context of the data.
---
### Interpretation
- **Contextual Clues**: The mention of Tokyo’s 1964 Olympics aligns with the historical debut of volleyball as an Olympic sport. However, the percentages likely refer to a different metric (e.g., medal distribution, event frequency, or athlete origins) not explicitly stated in the chat.
- **Possible Explanations**:
- **Tokyo’s High Value**: Could reflect the city’s role as the host of the 1964 Olympics, where volleyball was introduced.
- **Other Cities**: Osaka and Kyoto might represent Japanese cities with historical ties to volleyball, while Beijing could relate to later Olympic events (e.g., 2008). Mumbai’s low value might indicate limited participation or infrastructure.
- **Ambiguity**: The lack of a legend or axis labels in the data box leaves the exact meaning of the percentages open to interpretation. The data could represent:
- Percentage of Olympic volleyball medals won by athletes from these cities.
- Frequency of volleyball events held in these cities over time.
- A ranking of cities based on volleyball popularity or infrastructure.
---
### Conclusion
The image provides a snapshot of a chat conversation with a historical fact about volleyball and a list of cities with percentages. While the percentages suggest a ranking or distribution, the absence of context or labels makes it challenging to determine their precise significance. The data highlights Tokyo’s dominance, potentially tied to its 1964 Olympic hosting, but further clarification is needed to interpret the values accurately.