# Technical Document Extraction: Chat Interface Analysis
## 1. Image Overview
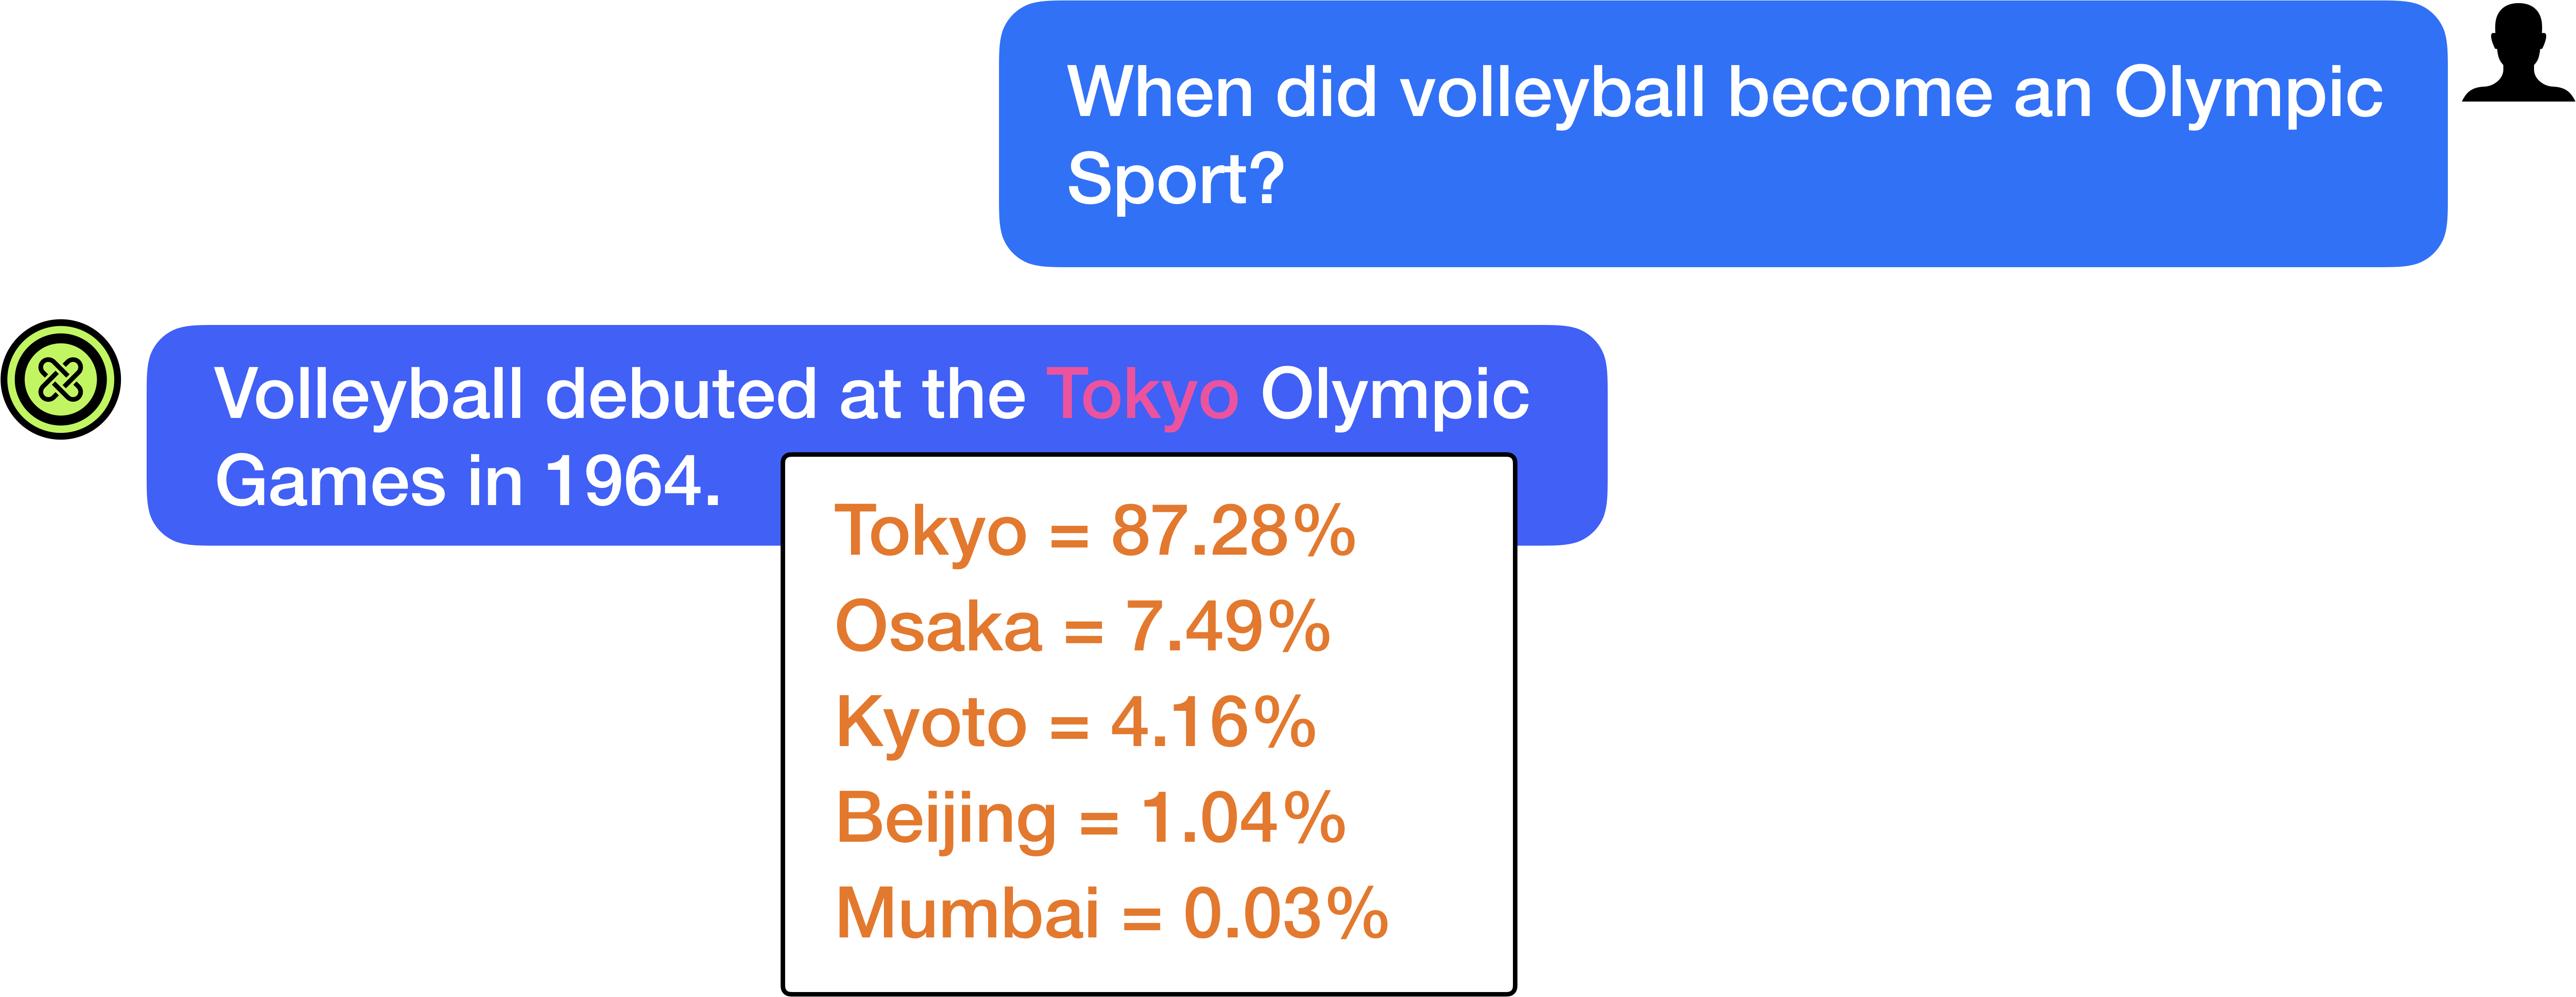
The image depicts a digital user interface (UI) representing a chat conversation between a human user and an AI assistant. The interface includes a query, a response with a highlighted keyword, and a technical pop-up box displaying probability or confidence scores for specific entities.
---
## 2. Component Isolation
### Region A: User Input (Header/Top Right)
* **Visual Description:** A blue speech bubble with white text, aligned to the right. A black silhouette icon of a person is positioned to the right of the bubble.
* **Transcribed Text:** "When did volleyball become an Olympic Sport?"
### Region B: AI Response (Main Body/Left)
* **Visual Description:** A blue speech bubble with white text, aligned to the left. A circular green icon containing a stylized "X" or knot symbol is positioned to the left of the bubble.
* **Transcribed Text:** "Volleyball debuted at the Tokyo Olympic Games in 1964."
* **Formatting Note:** The word **"Tokyo"** is highlighted in a pink/magenta font color within the blue bubble, indicating an interactive element or a specific entity extraction.
### Region C: Data Overlay/Pop-up (Center/Foreground)
* **Visual Description:** A white rectangular box with a black border, superimposed over the AI response bubble. It contains a list of geographic locations paired with percentage values.
* **Spatial Placement:** Centered horizontally, overlapping the bottom edge of the AI response bubble.
* **Text Color:** All text within this box is rendered in an orange/copper font.
---
## 3. Data Table Extraction (Pop-up Content)
The following table reconstructs the data found in the foreground pop-up box. This data appears to represent a "Top-K" prediction list or confidence scores for the entity "Tokyo" mentioned in the response.
| Entity (Location) | Value (Percentage) |
| :--- | :--- |
| Tokyo | 87.28% |
| Osaka | 7.49% |
| Kyoto | 4.16% |
| Beijing | 1.04% |
| Mumbai | 0.03% |
---
## 4. Technical Analysis & Trends
* **Primary Data Point:** "Tokyo" is the highest-ranked entity with a dominant confidence score of **87.28%**.
* **Trend Verification:** The values follow a sharp downward trend. There is a significant drop of **~79.79 percentage points** between the first result (Tokyo) and the second result (Osaka). The remaining values (Kyoto, Beijing, Mumbai) show a continuing exponential decay in probability.
* **Contextual Inference:** This image likely demonstrates an "Explainable AI" (XAI) or "Attribution" feature where the system shows the internal probability distribution for a specific fact or word choice generated in the response.
---
## 5. Language Declaration
* **Primary Language:** English (US).
* **Other Languages:** None detected. All geographic entities are written in English script.