# Technical Document Extraction: Control Value Analysis
## Chart Title
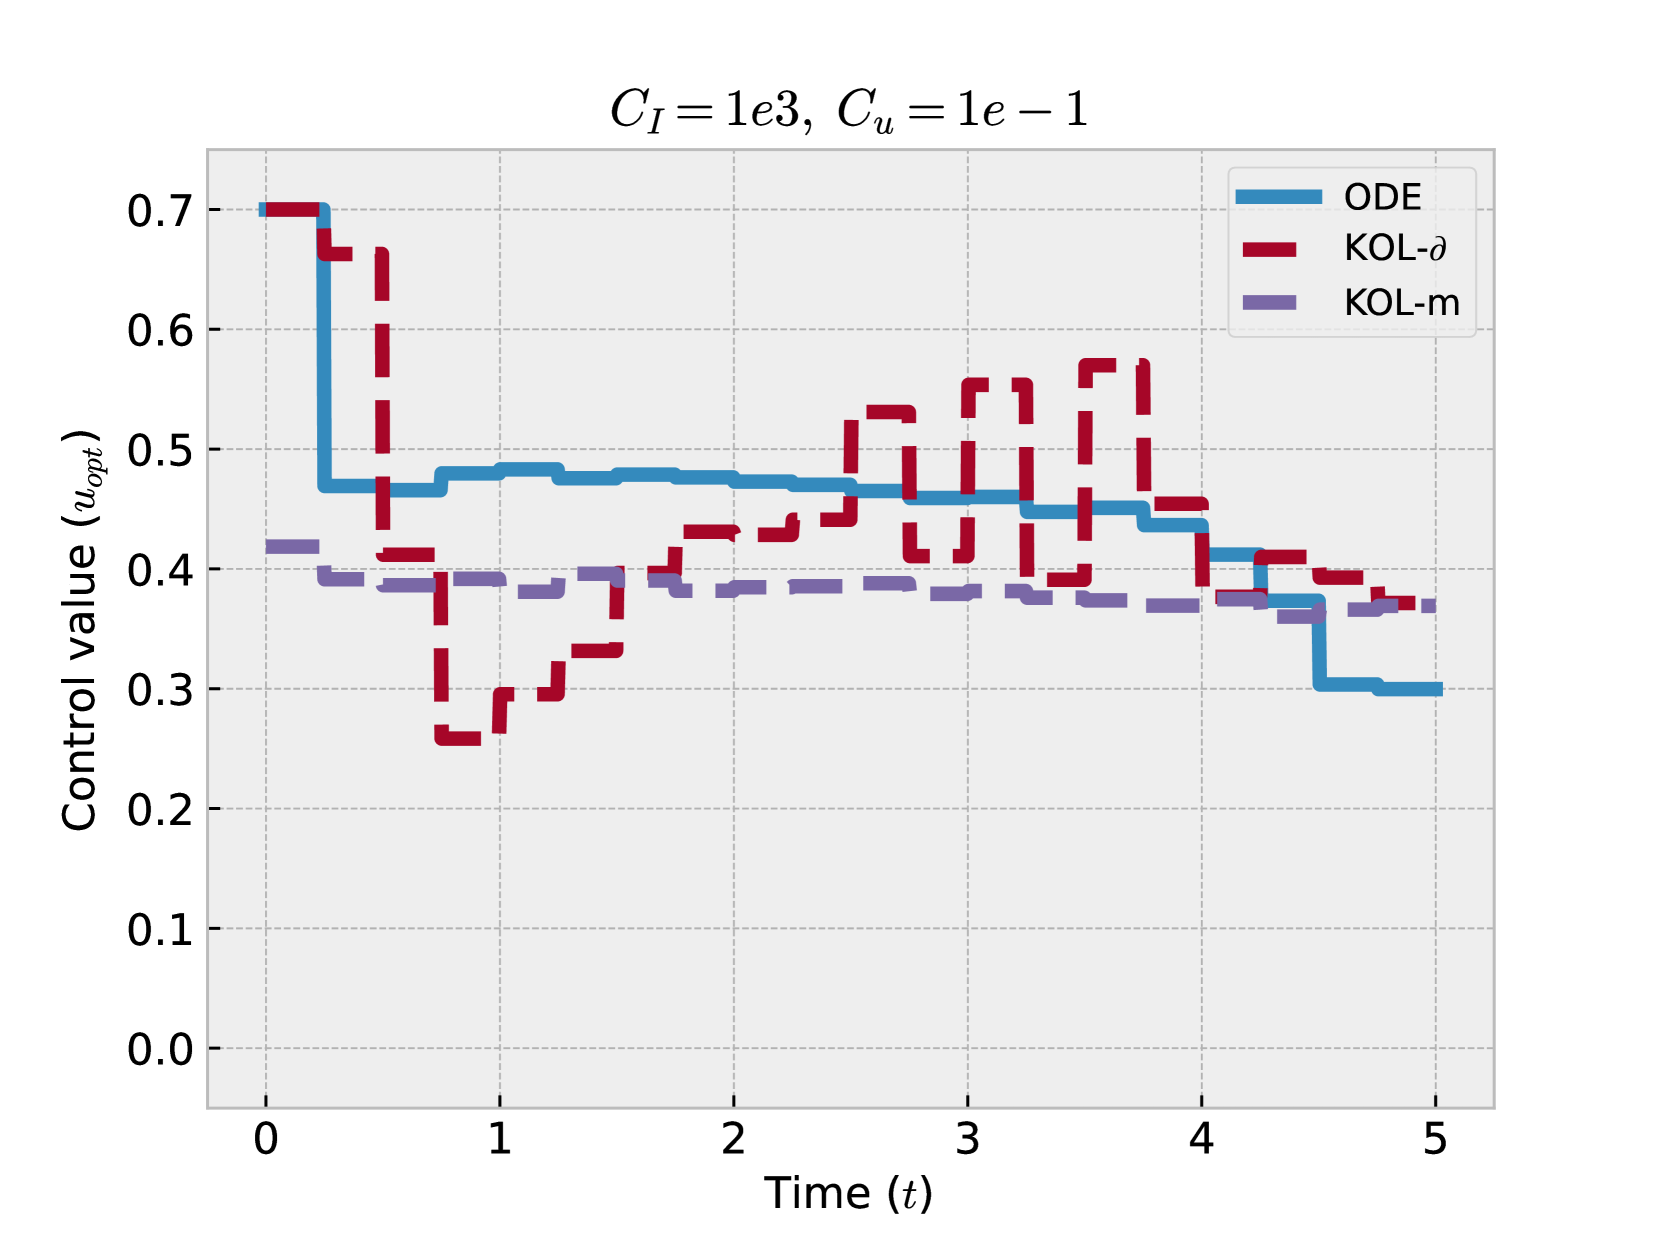
- **Title**: `C_I = 1e3, C_u = 1e-1`
## Axes Labels
- **X-axis**: `Time (t)`
- Range: `0` to `5`
- Increment: `1`
- **Y-axis**: `Control value (u_opt)`
- Range: `0.0` to `0.7`
- Increment: `0.1`
## Legend
- **ODE**: Blue line
- **KOL-δ**: Red line
- **KOL-m**: Purple line
## Key Trends and Data Points
1. **ODE (Blue Line)**
- Initial value: `0.7` at `t = 0`
- Sharp drop to `0.45` at `t ≈ 0.5`
- Stabilizes between `0.45` and `0.5` from `t ≈ 1` to `t ≈ 4`
- Final value: `0.3` at `t = 5`
2. **KOL-δ (Red Line)**
- Initial value: `0.7` at `t = 0`
- Sharp drop to `0.3` at `t ≈ 0.5`
- Oscillatory behavior with peaks at `0.55` (e.g., `t ≈ 2.5`, `t ≈ 3.5`)
- Final value: `0.35` at `t = 5`
3. **KOL-m (Purple Line)**
- Initial value: `0.4` at `t = 0`
- Gradual decline to `0.35` at `t ≈ 4`
- Minor fluctuations around `0.35` to `0.4`
- Final value: `0.35` at `t = 5`
## Observations
- **ODE** exhibits the most significant initial drop and stabilization.
- **KOL-δ** shows erratic oscillations after the initial drop.
- **KOL-m** demonstrates the smoothest decline with minimal fluctuations.
- All lines converge near `0.35` at `t = 5`.
## Embedded Text
- **Title Parameters**:
- `C_I = 1e3` (Inflow coefficient)
- `C_u = 1e-1` (Control coefficient)