\n
## Diagram: Network of Nodes with Numerical Labels
### Overview
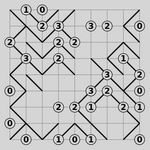
The image depicts a network of interconnected nodes arranged in a grid-like pattern. Each node is labeled with a numerical value ranging from 0 to 3. The connections between nodes are represented by lines, forming a complex web-like structure. The background is a light gray grid.
### Components/Axes
There are no explicit axes or legends in the traditional sense. The diagram consists of nodes and connecting lines. The numerical labels within the circles represent the value associated with each node. The grid provides a spatial reference but does not have labeled axes.
### Detailed Analysis or Content Details
The diagram consists of approximately 30 nodes. The numerical values within the nodes are distributed as follows (approximate counts):
* 0: ~8 occurrences
* 1: ~6 occurrences
* 2: ~9 occurrences
* 3: ~7 occurrences
The connections between nodes are directional, indicated by the arrowheads on the lines. The network appears to be non-hierarchical, with multiple paths and loops.
Here's a more detailed breakdown of the node values and their connections, reading row by row from top to bottom:
* **Row 1:** 1, 0, 2, 3, 3, 2, 0
* **Row 2:** 2, 3, 2, 2, 2, 1
* **Row 3:** 3, 2, 2, 3, 2, 0
* **Row 4:** 0, 3, 2, 1, 2, 1, 0
* **Row 5:** 0, 1, 0, 1, 0, 0
The connections are complex and do not follow a simple pattern. There are several nodes with multiple incoming and outgoing connections.
### Key Observations
* The values 2 and 3 appear more frequently than 0 and 1.
* The network is densely connected, with most nodes having at least two connections.
* There are several loops and cycles within the network.
* The distribution of values does not appear to be random; there may be some underlying pattern or rule governing the assignment of values to nodes.
### Interpretation
This diagram likely represents a state transition network or a similar type of graph where nodes represent states and edges represent transitions between states. The numerical values within the nodes could represent various attributes, such as cost, probability, or reward associated with each state. The directional connections indicate the flow of transitions.
Without additional context, it is difficult to determine the specific meaning of the diagram. However, the complexity of the network suggests that it models a system with multiple interacting components and a rich set of possible behaviors. The frequent occurrence of values 2 and 3 might indicate that these states are more common or desirable than states with values 0 and 1.
The diagram could be used to analyze the behavior of a system, identify critical paths, or optimize performance. It could also be a representation of a decision-making process, where nodes represent choices and edges represent actions.
The absence of a clear legend or axis labels suggests that the diagram is intended for a specialized audience who are already familiar with the underlying concepts and terminology. It is a visual representation of a complex system, and its interpretation requires a deep understanding of the domain it represents.