## Diagram: Dual Counter-Rotating Flow Loops
### Overview
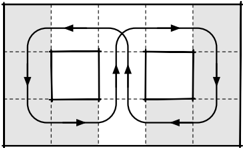
The image is a schematic diagram illustrating two adjacent, counter-rotating flow loops. It utilizes a grid-based background with specific shaded regions to define the environment in which these flows occur. There is no text or numerical data present in the image.
### Components/Axes
* **Flow Paths:** Two rectangular loops, each containing a central square outline.
* **Directional Indicators:** Arrows placed on the segments of the flow paths to indicate the direction of movement.
* **Grid/Background:** A 3x2 grid structure defined by dashed lines.
* **Shading:** Gray-shaded regions contrasted against white regions.
### Detailed Analysis
The diagram can be segmented into two primary flow systems:
**1. Left Flow Loop (Counter-Clockwise)**
* **Trend:** The flow moves in a counter-clockwise direction.
* **Path:**
* Top segment: Moves left.
* Left segment: Moves down.
* Bottom segment: Moves right.
* Right segment: Moves up (this segment is shared with the right loop).
**2. Right Flow Loop (Clockwise)**
* **Trend:** The flow moves in a clockwise direction.
* **Path:**
* Top segment: Moves right.
* Right segment: Moves down.
* Bottom segment: Moves left.
* Left segment: Moves up (this segment is shared with the left loop).
**3. Central Interaction**
* The two loops are positioned side-by-side.
* The inner vertical segments of both loops are adjacent and both arrows point **upward**. This indicates a central upwelling or convergence zone between the two loops.
**4. Grid and Shading**
* The background is divided into a 3x2 grid.
* **Shading Pattern:**
* The left column is entirely shaded.
* The right column is entirely shaded.
* The bottom-middle section is shaded.
* The top-middle section is white.
* The two central squares are white.
### Key Observations
* **Symmetry:** The diagram is bilaterally symmetrical along the vertical axis running between the two loops.
* **Flow Convergence:** The most notable feature is the parallel upward flow in the center, suggesting a source of energy or fluid injection at the bottom center, or a thermal plume rising between two cooler regions.
* **Structural Constraints:** The squares appear to act as obstacles or "cores" around which the fluid circulates.
### Interpretation
This diagram is a classic representation of **convection cells** in fluid dynamics (such as Rayleigh-Bénard convection).
* **Physical Meaning:** The counter-rotating loops indicate that fluid is rising in the center and sinking at the outer edges. The central upwelling (where both arrows point up) suggests a heat source located at the bottom center of the system.
* **Shading Significance:** The shaded regions likely represent cooler, denser fluid or solid boundaries, while the white regions (the central squares and the top-middle area) represent warmer, less dense fluid or open channels.
* **Peircean Investigative Note:** The absence of labels suggests this is a generalized model rather than a specific data plot. It is designed to communicate the *concept* of circulation patterns rather than specific measurements. The "squares" likely represent physical objects (like heat pipes or structural supports) that the fluid is forced to circulate around.