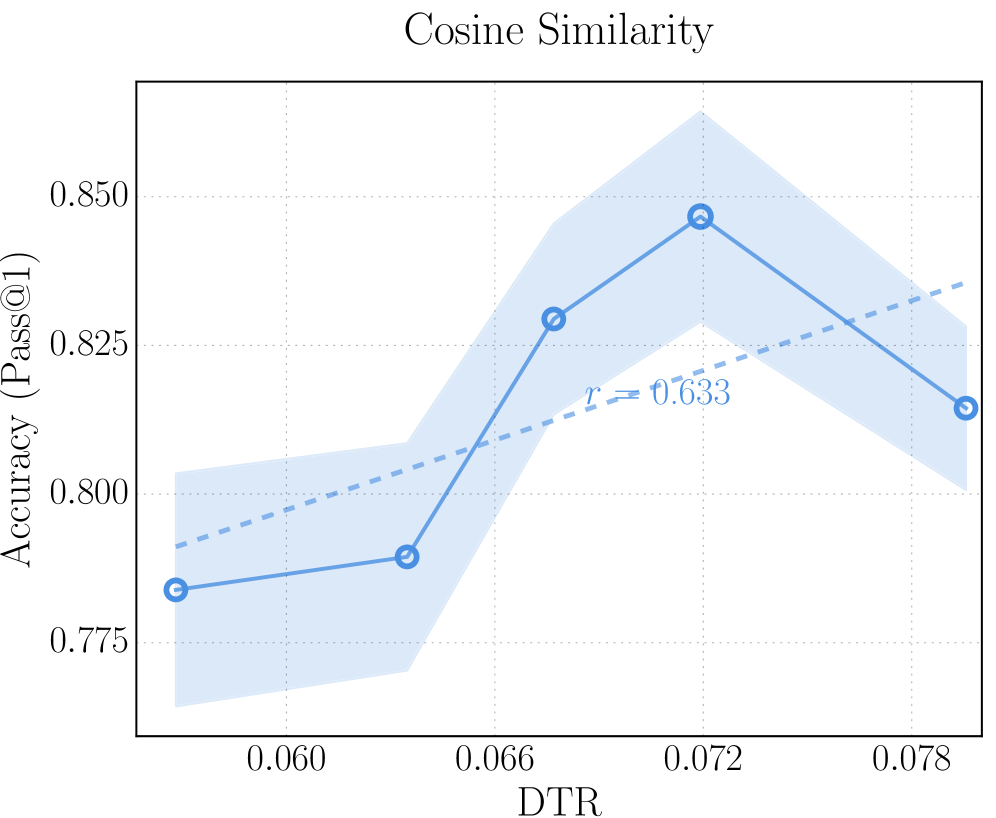
## Chart: Cosine Similarity vs. DTR
### Overview
The image is a line chart showing the relationship between "DTR" (x-axis) and "Accuracy (Pass@1)" (y-axis). The chart includes a solid blue line representing the accuracy at different DTR values, a shaded blue area around the line indicating uncertainty, and a dashed blue line representing a linear regression fit. The title of the chart is "Cosine Similarity".
### Components/Axes
* **Title:** Cosine Similarity
* **X-axis:** DTR (values: 0.060, 0.066, 0.072, 0.078)
* **Y-axis:** Accuracy (Pass@1) (values: 0.775, 0.800, 0.825, 0.850)
* **Data Series 1:** Accuracy vs. DTR (solid blue line with circular markers)
* **Uncertainty:** Shaded blue area around the accuracy line
* **Linear Regression:** Dashed blue line
* **Correlation Coefficient:** r = 0.633
### Detailed Analysis
* **X-axis (DTR):** The x-axis ranges from approximately 0.057 to 0.081, with major tick marks at 0.060, 0.066, 0.072, and 0.078.
* **Y-axis (Accuracy (Pass@1)):** The y-axis ranges from approximately 0.77 to 0.86, with major tick marks at 0.775, 0.800, 0.825, and 0.850.
* **Accuracy vs. DTR Data Series:**
* At DTR = 0.060, Accuracy is approximately 0.782.
* At DTR = 0.066, Accuracy is approximately 0.785.
* At DTR = 0.072, Accuracy is approximately 0.828.
* At DTR = 0.078, Accuracy is approximately 0.845.
* At DTR = 0.081, Accuracy is approximately 0.812.
* **Trend of Accuracy:** The accuracy generally increases from DTR 0.060 to 0.072, then decreases from 0.072 to 0.078.
* **Linear Regression:** The dashed blue line shows a positive correlation between DTR and Accuracy.
* **Correlation Coefficient:** The correlation coefficient (r) is 0.633, indicating a moderate positive correlation.
### Key Observations
* The accuracy peaks at a DTR value of approximately 0.072.
* The uncertainty (shaded area) varies with DTR, being wider at some points than others.
* The linear regression line suggests a general positive trend, but the actual data points deviate from this line, especially around DTR = 0.072.
### Interpretation
The chart suggests that there is a relationship between DTR and Accuracy (Pass@1) based on Cosine Similarity. The accuracy initially increases with DTR, reaches a peak, and then decreases. The positive correlation coefficient (r = 0.633) indicates a moderate positive linear relationship, but the non-linear trend of the data suggests that a linear model may not fully capture the relationship between DTR and Accuracy. The shaded area represents the uncertainty in the accuracy measurement, which could be due to various factors such as data variability or measurement error. The peak in accuracy at a specific DTR value (around 0.072) could indicate an optimal setting for the system being evaluated.