## Line Chart: Cosine Similarity
### Overview
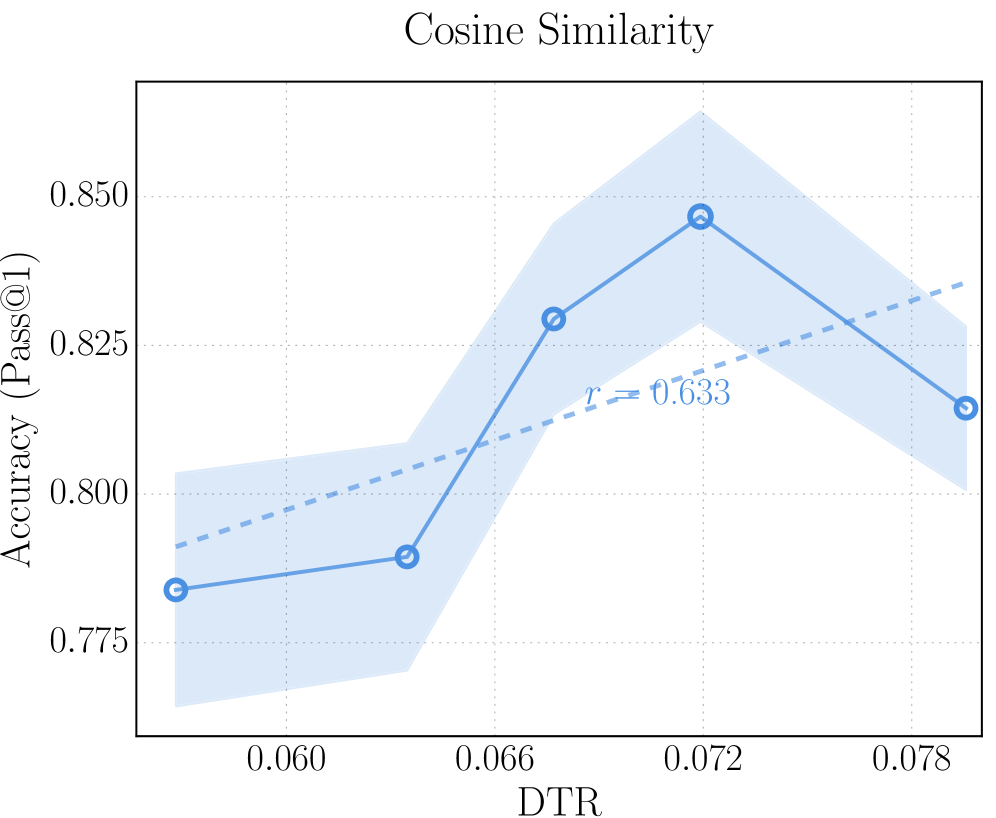
This image presents a line chart illustrating the relationship between DTR (likely a measure of distance or time) and Accuracy (Pass@1). The chart includes a solid blue line representing the primary data series, a dashed grey line representing another data series, and shaded blue regions indicating the confidence interval around the solid blue line. A correlation coefficient (r = 0.633) is also displayed.
### Components/Axes
* **Title:** Cosine Similarity
* **X-axis:** DTR, ranging from approximately 0.060 to 0.078. Axis markers are present at 0.060, 0.066, 0.072, and 0.078.
* **Y-axis:** Accuracy (Pass@1), ranging from approximately 0.775 to 0.850. Axis markers are present at 0.775, 0.800, 0.825, and 0.850.
* **Data Series 1 (Solid Blue Line):** Represents the primary relationship between DTR and Accuracy.
* **Data Series 2 (Dashed Grey Line):** Represents a secondary relationship between DTR and Accuracy.
* **Confidence Interval (Shaded Blue Region):** Indicates the uncertainty around the solid blue line.
* **Correlation Coefficient:** r = 0.633, positioned near the center of the chart.
### Detailed Analysis
**Data Series 1 (Solid Blue Line):**
The solid blue line exhibits an overall upward trend, then a slight decline.
* At DTR = 0.060, Accuracy is approximately 0.776.
* At DTR = 0.066, Accuracy is approximately 0.795.
* At DTR = 0.072, Accuracy reaches a peak of approximately 0.845.
* At DTR = 0.078, Accuracy decreases to approximately 0.815.
**Data Series 2 (Dashed Grey Line):**
The dashed grey line shows a generally increasing trend, but with more fluctuation.
* At DTR = 0.060, Accuracy is approximately 0.790.
* At DTR = 0.066, Accuracy is approximately 0.800.
* At DTR = 0.072, Accuracy is approximately 0.825.
* At DTR = 0.078, Accuracy is approximately 0.820.
**Confidence Interval:**
The shaded blue region around the solid blue line is wider at DTR values around 0.066 and 0.078, indicating greater uncertainty in the accuracy estimates at those points. The confidence interval is narrower around DTR = 0.072, suggesting more confidence in the accuracy estimate at that point.
### Key Observations
* The correlation coefficient of 0.633 suggests a moderate positive correlation between DTR and Accuracy.
* Accuracy generally increases with increasing DTR up to a point (around 0.072), after which it slightly decreases.
* The confidence interval indicates that the relationship between DTR and Accuracy is more uncertain at the lower and upper ends of the DTR range.
* The dashed grey line consistently shows higher accuracy values than the solid blue line, but the difference is small.
### Interpretation
The chart suggests that there is a sweet spot for DTR, where accuracy is maximized (around 0.072). Increasing DTR beyond this point leads to a slight decrease in accuracy. The moderate correlation coefficient indicates that DTR is a factor influencing accuracy, but it is not the sole determinant. The confidence intervals highlight the inherent variability in the accuracy measurements. The dashed grey line could represent a different model or approach that consistently performs slightly better than the primary model represented by the solid blue line. The data suggests that optimizing DTR is important for maximizing accuracy, but other factors also play a role. The "Cosine Similarity" title implies that the accuracy is being measured based on the similarity between some vectors or representations, and DTR might be a parameter controlling the distance or threshold used in that similarity calculation.