## Line Chart with Confidence Interval: Cosine Similarity vs. Accuracy
### Overview
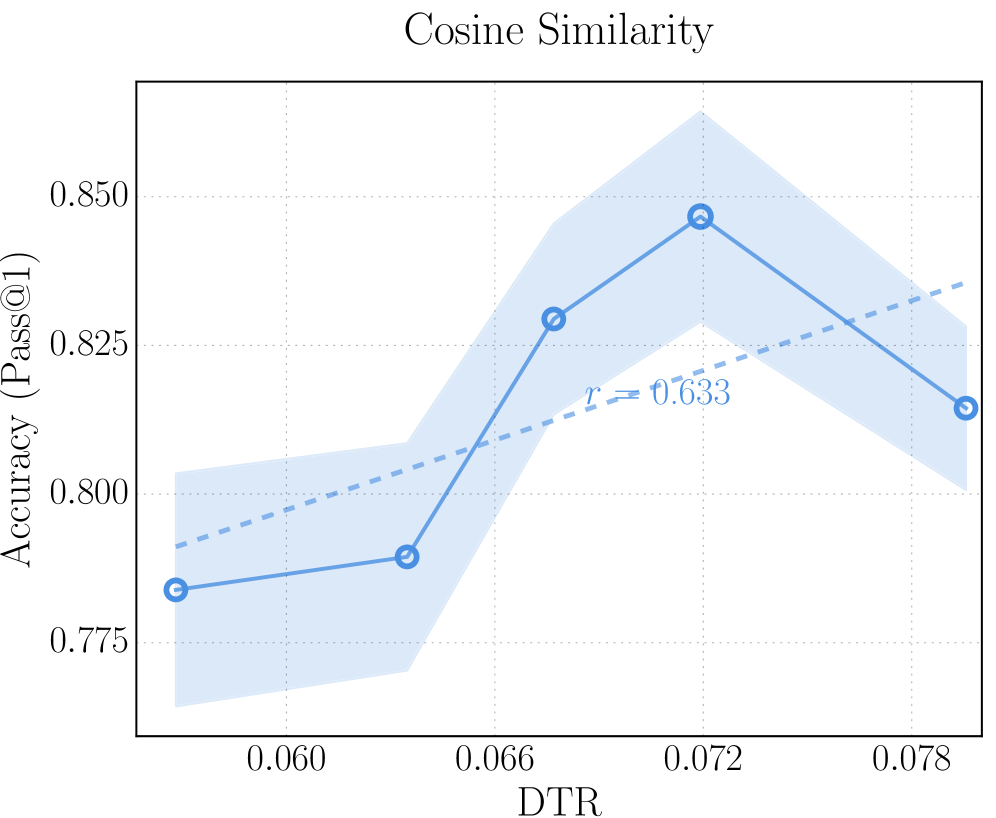
The image displays a line chart titled "Cosine Similarity," plotting the relationship between a variable labeled "DTR" on the x-axis and "Accuracy (Pass@1)" on the y-axis. The chart features a primary data series (solid blue line with circular markers), a shaded confidence interval, and a dashed trend line with an annotated correlation coefficient.
### Components/Axes
* **Title:** "Cosine Similarity" (centered at the top).
* **Y-Axis:**
* **Label:** "Accuracy (Pass@1)" (rotated vertically on the left).
* **Scale:** Linear scale ranging from approximately 0.775 to 0.850.
* **Major Ticks/Labels:** 0.775, 0.800, 0.825, 0.850.
* **X-Axis:**
* **Label:** "DTR" (centered at the bottom).
* **Scale:** Linear scale.
* **Major Ticks/Labels:** 0.060, 0.066, 0.072, 0.078.
* **Data Series:**
* **Primary Line:** A solid blue line connecting five circular data points.
* **Confidence Interval:** A light blue shaded region surrounding the primary line, indicating variability or uncertainty.
* **Trend Line:** A dashed blue line showing the overall linear trend.
* **Legend/Annotation:** The text "r = 0.633" is placed in the upper-middle area of the plot, near the trend line, indicating the Pearson correlation coefficient.
### Detailed Analysis
**Data Points (Approximate Coordinates):**
The primary data series (solid blue line) shows the following approximate (DTR, Accuracy) pairs:
1. (0.058, 0.785)
2. (0.064, 0.790)
3. (0.068, 0.830)
4. (0.072, 0.848)
5. (0.078, 0.815)
**Trend Verification:**
* **Primary Line Trend:** The line slopes gently upward from the first to the second point, then rises steeply to a peak at the fourth point (DTR ≈ 0.072), before declining sharply at the fifth point.
* **Dashed Trend Line:** This line shows a consistent, moderate upward slope from left to right across the entire x-axis range, indicating an overall positive linear relationship.
* **Correlation:** The annotation "r = 0.633" quantifies this positive linear correlation as moderate.
**Confidence Interval:**
The shaded blue region is narrowest at the first and last data points and widest around the peak (DTR ≈ 0.072), suggesting greater uncertainty in the accuracy estimate near the maximum value.
### Key Observations
1. **Non-Linear Relationship:** The primary data does not follow a straight line. It exhibits a clear peak, suggesting an optimal DTR value for accuracy.
2. **Peak Performance:** The highest accuracy (≈0.848) occurs at a DTR value of approximately 0.072.
3. **Post-Peak Decline:** After the peak at DTR=0.072, accuracy decreases significantly as DTR increases to 0.078.
4. **Moderate Positive Correlation:** Despite the non-linear peak, the overall trend (dashed line) and the correlation coefficient (r=0.633) indicate that higher DTR values are generally associated with higher accuracy within the observed range.
### Interpretation
The chart demonstrates that the metric "Cosine Similarity" (likely used as a proxy or component for model performance) has a non-monotonic relationship with "Accuracy (Pass@1)." While the general trend is positive (higher DTR correlates with higher accuracy), there is a distinct optimum point.
* **What it suggests:** The data implies that increasing the DTR parameter improves model accuracy only up to a certain point (around 0.072). Beyond this threshold, further increases in DTR are detrimental to performance. This is a classic "inverted-U" or "diminishing returns" pattern common in parameter tuning.
* **Relationship between elements:** The primary line shows the empirical, observed relationship. The dashed trend line and its `r` value summarize the overall direction, smoothing over the local peak. The confidence interval highlights that the model's performance is most variable (or the estimate is least certain) precisely where it is highest.
* **Notable anomaly:** The sharp decline after the peak is the most critical feature. It indicates that the DTR parameter must be carefully tuned, as simply maximizing it will not yield the best results. The optimal operating point is clearly defined within the tested range.