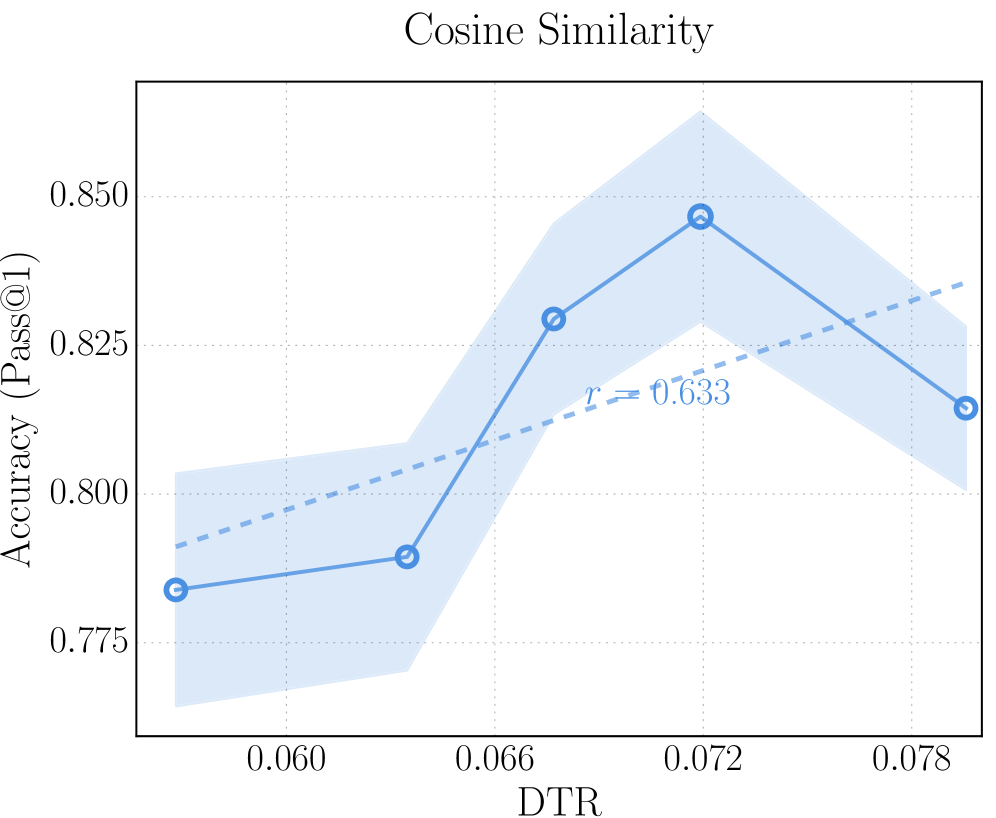
## Line Chart: Cosine Similarity
### Overview
The chart illustrates the relationship between DTR (Dynamic Time Refinement) and Accuracy (Pass@1) using a blue line with shaded confidence intervals. A dashed trend line with a correlation coefficient (r = 0.633) is overlaid, indicating a moderate positive relationship. The data suggests a non-linear trend with a peak accuracy at a specific DTR value.
### Components/Axes
- **Title**: "Cosine Similarity" (top-center)
- **X-axis**: Labeled "DTR" with values ranging from 0.060 to 0.078 (increments of 0.006).
- **Y-axis**: Labeled "Accuracy (Pass@1)" with values from 0.775 to 0.850 (increments of 0.005).
- **Legend**: No explicit legend, but the blue line and shaded area represent the primary data series. The dashed line represents the trend line.
- **Data Points**: Blue circles mark specific DTR-accuracy pairs.
- **Shaded Area**: Light blue region around the blue line indicates variability or confidence intervals.
### Detailed Analysis
- **Data Points**:
- At DTR = 0.060: Accuracy ≈ 0.780
- At DTR = 0.066: Accuracy ≈ 0.790
- At DTR = 0.072: Accuracy ≈ 0.845 (peak)
- At DTR = 0.078: Accuracy ≈ 0.815
- **Trend Line**: Dashed line with r = 0.633, showing a moderate positive correlation between DTR and Accuracy.
- **Shaded Area**: The width of the shaded region varies, suggesting increasing uncertainty or variability in Accuracy as DTR increases.
### Key Observations
1. **Peak Accuracy**: The highest Accuracy (0.845) occurs at DTR = 0.072, followed by a decline at DTR = 0.078.
2. **Non-Linear Relationship**: Accuracy increases sharply from DTR = 0.060 to 0.072, then decreases, indicating a potential optimal DTR value.
3. **Moderate Correlation**: The trend line (r = 0.633) suggests a positive but not strongly linear relationship between DTR and Accuracy.
4. **Variability**: The shaded area widens as DTR increases, implying greater uncertainty in Accuracy predictions at higher DTR values.
### Interpretation
The chart demonstrates that increasing DTR improves Accuracy up to a critical point (DTR = 0.072), after which performance declines. This suggests an optimal DTR threshold for maximizing Accuracy. The moderate correlation (r = 0.633) indicates that while DTR influences Accuracy, other factors may also play a role. The shaded area highlights the model's sensitivity to DTR, with higher variability at larger DTR values. The peak at DTR = 0.072 could represent a balance between computational complexity and performance, warranting further investigation into the underlying mechanisms.