## Hierarchical Diagram: Top Event Structure
### Overview
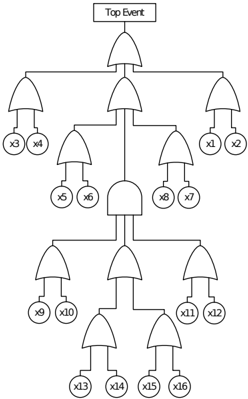
The image depicts a hierarchical tree diagram with a central "Top Event" node at the apex, branching into multiple levels of sub-nodes. Each node is labeled with a unique identifier (e.g., x1, x2, ..., x16), and the structure follows a branching pattern where each parent node splits into two or three child nodes. The diagram emphasizes hierarchical relationships and connectivity between nodes.
### Components/Axes
- **Top Event**: The root node at the top of the diagram, serving as the origin of all branches.
- **Nodes**: Labeled x1 to x16, arranged in a tree-like structure. Each node is connected to its parent via a vertical line, with child nodes positioned directly below.
- **Branching Pattern**:
- The "Top Event" splits into three primary branches:
1. Left branch (x3, x4)
2. Middle branch (x5, x6)
3. Right branch (x1, x2)
- The middle branch (x5, x6) further splits into two sub-branches: x8 and x7.
- Subsequent levels show additional splits, culminating in the bottom level with x13, x14, x15, and x16.
### Detailed Analysis
- **Labels and Positions**:
- **Top Event**: Centered at the top, connected to three primary branches.
- **First-Level Nodes**:
- Left: x3 (left) and x4 (right) under the left branch.
- Middle: x5 (left) and x6 (right) under the middle branch.
- Right: x1 (left) and x2 (right) under the right branch.
- **Second-Level Nodes**:
- Middle branch splits into x8 (left) and x7 (right).
- **Third-Level Nodes**:
- x8 splits into x9 (left) and x10 (right).
- x7 splits into x11 (left) and x12 (right).
- **Bottom-Level Nodes**:
- x9 splits into x13 (left) and x14 (right).
- x10 splits into x15 (left) and x16 (right).
- x11 and x12 do not have further splits in the diagram.
- **Flow Direction**: All connections flow downward from parent to child nodes, with no upward or lateral connections.
### Key Observations
- The diagram is strictly hierarchical, with no cycles or feedback loops.
- The labeling follows a sequential pattern (x1 to x16), but the distribution is uneven across branches.
- The middle branch (x5, x6) has the most complex sub-structure, with two additional splits (x8, x7) and their children.
- The bottom level (x13–x16) represents the terminal nodes with no further branching.
### Interpretation
This diagram likely represents a process flow, decision tree, or organizational structure where each node signifies a discrete event, decision, or component. The "Top Event" acts as the initiating point, with subsequent nodes representing sub-events or dependencies. The uneven branching suggests variability in the complexity or number of sub-events at different stages. The absence of feedback loops implies a linear progression from the top event to terminal nodes. The labels (x1–x16) may correspond to specific stages, tasks, or entities in a larger system, though their exact meaning is not provided in the image.