## Fault Tree Diagram: Top Event Analysis
### Overview
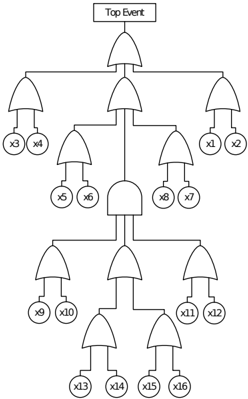
The image presents a fault tree diagram, a top-down, deductive failure analysis used to determine how systems can fail, identify the best ways to reduce risk, and determine (or get a feeling for) event rates of a safety accident or a particular system level (functional) failure. The diagram starts with a "Top Event" and branches down through a series of logic gates (AND, OR) to identify potential causes or contributing factors, represented by basic events (x1, x2, ..., x16).
### Components/Axes
* **Top Event:** A rectangular box at the top of the diagram labeled "Top Event".
* **Basic Events:** Represented by circles labeled x1 through x16.
* **Logic Gates:**
* **OR Gate:** An upside-down U-shaped symbol. The output event occurs if at least one of the input events occurs.
* **AND Gate:** A U-shaped symbol. The output event occurs only if all input events occur.
* **Connecting Lines:** Lines connecting events and gates, indicating the flow of logic.
### Detailed Analysis
The diagram can be broken down into levels, starting from the top:
1. **Level 1:** The "Top Event" is connected to an OR gate. This OR gate has three inputs.
2. **Level 2:** The three inputs to the OR gate are:
* An OR gate connected to basic events x3 and x4.
* An OR gate connected to the next level.
* An OR gate connected to basic events x1 and x2.
3. **Level 3:** The central OR gate from Level 2 is connected to:
* An AND gate connected to basic events x5 and x6.
* An AND gate connected to basic events x8 and x7.
4. **Level 4:** The outputs of the AND gates from Level 3 feed into an AND gate.
5. **Level 5:** The output of the AND gate from Level 4 feeds into an OR gate. This OR gate has two inputs.
6. **Level 6:** The two inputs to the OR gate are:
* An OR gate connected to basic events x9 and x10.
* An OR gate connected to the next level.
* An OR gate connected to basic events x11 and x12.
7. **Level 7:** The central OR gate from Level 6 is connected to:
* An AND gate connected to basic events x13 and x14.
* An AND gate connected to basic events x15 and x16.
### Key Observations
* The diagram uses a combination of OR and AND gates to model the relationships between events.
* The diagram is structured hierarchically, with the "Top Event" at the root and basic events at the leaves.
* The diagram includes 16 basic events (x1 to x16).
### Interpretation
The fault tree diagram visually represents the logical relationships between potential causes and a specific "Top Event." By tracing the paths from the basic events (x1-x16) through the logic gates, one can identify the combinations of failures that could lead to the "Top Event." The use of both OR and AND gates allows for modeling situations where a single failure can cause the "Top Event" (OR gate) or where multiple failures must occur simultaneously (AND gate). This type of analysis is crucial for risk assessment and safety engineering, as it helps to pinpoint critical vulnerabilities in a system and prioritize mitigation efforts.