\n
## Diagram: Fault Tree Analysis
### Overview
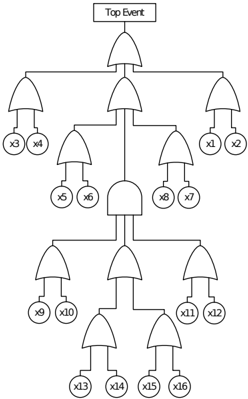
The image depicts a fault tree diagram, a top-down, deductive failure analysis method. It visually represents the logical relationships between a system's failure (the "Top Event") and the events that can cause it. The diagram uses logic gates (AND, OR) to connect events, showing how combinations of lower-level failures can lead to the top-level failure.
### Components/Axes
The diagram consists of:
* **Top Event:** A rectangular box labeled "Top Event" at the top center.
* **Logic Gates:** OR gates (curved shape) and AND gates (pointed shape) connecting events.
* **Basic Events:** Circles labeled "x1" through "x16" representing potential failures at the lowest level.
* **Connecting Lines:** Lines indicating the flow of logic and dependencies between events and gates.
### Detailed Analysis or Content Details
The diagram can be described level by level, starting from the top:
1. **Level 1 (Top Event):** The "Top Event" is connected to three OR gates. This means the Top Event can occur if *any* of the three events connected to these OR gates occur.
2. **Level 2:**
* The first OR gate is connected to two basic events: x1 and x2.
* The second OR gate is connected to two basic events: x3 and x4.
* The third OR gate is connected to two basic events: x5 and x6.
3. **Level 3:**
* The output of the first OR gate (x1 or x2) is connected to an AND gate along with the output of the second OR gate (x3 or x4). This AND gate means that *both* (x1 or x2) *and* (x3 or x4) must occur for the next level to be triggered.
* The output of the third OR gate (x5 or x6) is connected to an AND gate with the output of the AND gate from the previous step.
4. **Level 4:**
* The output of the AND gate (from Level 3) is connected to three OR gates.
* The first OR gate is connected to two basic events: x7 and x8.
* The second OR gate is connected to two basic events: x9 and x10.
* The third OR gate is connected to two basic events: x11 and x12.
5. **Level 5:**
* The output of the first OR gate (x7 or x8) is connected to an AND gate.
* The output of the second OR gate (x9 or x10) is connected to an AND gate.
* The output of the third OR gate (x11 or x12) is connected to an AND gate.
6. **Level 6:**
* Each of the three AND gates (from Level 5) is connected to two basic events.
* The first AND gate is connected to x13 and x14.
* The second AND gate is connected to x15 and x16.
* The third AND gate is connected to no events.
### Key Observations
* The diagram is symmetrical in its structure, with branching occurring at multiple levels.
* The use of both OR and AND gates indicates a complex relationship between the basic events and the top event.
* The diagram shows that the Top Event can occur through multiple pathways, some requiring multiple failures to occur simultaneously (AND gates), while others require only one failure (OR gates).
* The final AND gate on the right side of the diagram is connected to no events, which is an anomaly.
### Interpretation
This fault tree diagram is a visual representation of a system's potential failure modes. It allows engineers to identify critical components and events that contribute most significantly to the overall system failure. By analyzing the diagram, they can prioritize efforts to improve system reliability and safety. The presence of both OR and AND gates highlights the need to address both single-point failures (OR gates) and combinations of failures (AND gates). The anomaly of the unconnected AND gate suggests a potential error in the diagram or a missing component in the analysis. The diagram suggests that the Top Event is dependent on a complex interplay of events, and mitigating the risk of the Top Event requires addressing failures at multiple levels of the system. The diagram is a tool for risk assessment and mitigation, helping to identify vulnerabilities and improve system resilience.