## Fault Tree Diagram: System Failure Analysis
### Overview
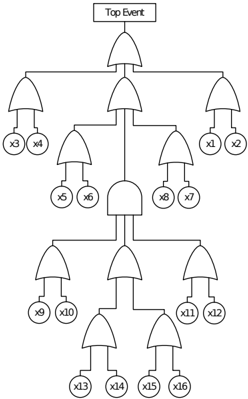
The image displays a standard fault tree diagram, a top-down, deductive failure analysis tool used in reliability engineering and safety engineering. It graphically represents the logical relationships between a system-level failure (the "Top Event") and the combinations of lower-level component failures or events that can cause it. The diagram uses standard symbols for logic gates (OR and AND) and basic events.
### Components/Axes
* **Top Event:** A rectangle at the very top of the diagram labeled **"Top Event"**. This represents the system failure under analysis.
* **Logic Gates:**
* **OR Gates:** Represented by a symbol with a curved base and a pointed top (resembling a shield or a bell). An OR gate output occurs if *any* of its input events occur.
* **AND Gate:** Represented by a symbol with a flat base and a rounded top (resembling a D). An AND gate output occurs only if *all* of its input events occur.
* **Basic Events:** Represented by circles. These are the root, undeveloped failure events at the bottom of the tree. They are labeled with identifiers from **x1** to **x16**.
* **Structure:** The diagram is hierarchical, flowing from the single Top Event downward through multiple levels of gates to the 16 basic events.
### Detailed Analysis
The fault tree is structured in a top-down hierarchy. The logical flow is as follows:
1. **Level 1 (Directly under Top Event):** The Top Event is the output of a single **OR gate**. This means the Top Event occurs if *any* of the three events feeding into this gate occur.
2. **Level 2 (Inputs to the top OR gate):** The three inputs are themselves the outputs of three separate gates:
* **Left Branch:** An **OR gate** whose inputs are basic events **x3** and **x4**.
* **Center Branch:** An **OR gate** whose inputs are:
* An **OR gate** (from Level 3) with inputs **x5** and **x6**.
* An **AND gate** (from Level 3).
* An **OR gate** (from Level 3) with inputs **x8** and **x7**.
* **Right Branch:** An **OR gate** whose inputs are basic events **x1** and **x2**.
3. **Level 3 (Inputs to the center OR gate):** As noted, this includes two OR gates and one central **AND gate**.
4. **Level 4 (Inputs to the AND gate):** The AND gate has three inputs, which are the outputs of three OR gates from Level 4:
* **Left:** An **OR gate** with inputs **x9** and **x10**.
* **Center:** An **OR gate** with inputs **x13** and **x14**.
* **Right:** An **OR gate** with inputs **x15** and **x16**.
5. **Level 5 (Basic Events):** The lowest level consists of the 16 basic events (**x1** through **x16**), each feeding into the OR gates at Level 4.
**Logical Summary (Boolean Expression):**
The Top Event (T) can be expressed as:
`T = (x3 OR x4) OR ( (x5 OR x6) OR ( (x9 OR x10) AND (x13 OR x14) AND (x15 OR x16) ) OR (x8 OR x7) ) OR (x1 OR x2)`
### Key Observations
* **Dominant Logic:** The tree is heavily dominated by **OR gates**. The Top Event itself is an OR of three major branches, and most sub-branches are also OR combinations. This indicates a system with many single points of failure; the failure of any one of numerous components or sub-systems can lead to the top-level failure.
* **Critical AND Gate:** There is only one **AND gate** in the entire tree, located deep in the center branch. This represents a point of redundancy or a requirement for multiple simultaneous failures. For this specific sub-system to fail, three separate conditions (each being an OR of two basic events) must occur concurrently.
* **Symmetry and Grouping:** The basic events are grouped in pairs (x1/x2, x3/x4, x5/x6, etc.) under OR gates. This suggests a design where components may be paired for redundancy at a local level, but the overall system architecture connects these pairs in a way that does not provide system-level redundancy (due to the overarching OR logic).
* **Spatial Layout:** The diagram is vertically oriented and largely symmetrical. The single AND gate is centrally placed, drawing attention as the most complex logical node. The legend (gate symbols) is not explicitly shown but is implied by standard fault tree notation.
### Interpretation
This fault tree models a system with **low overall reliability** from a fault-tolerance perspective. The prevalence of OR gates means the system's failure rate is essentially the sum of the failure rates of its many components and sub-systems. It is a "series" system in reliability terms.
The single AND gate represents the only subsystem with built-in redundancy. For that specific sub-function to fail, three separate fault conditions must align simultaneously. This is likely a critical or high-risk function that the designers have attempted to protect through redundancy.
**Investigative Reading (Peircean):** The diagram is an *abductive* representation—it proposes a model of how failures *could* combine. It is a *deductive* tool for analysis: given the occurrence of basic events, one can deduce if the top event occurs. For an engineer, this diagram is a map for risk assessment. It highlights that improving system reliability would require addressing the numerous OR-gate pathways, perhaps by introducing redundancy at higher levels, rather than focusing solely on the already-protected function under the AND gate. The pairing of basic events (x1/x2, etc.) might indicate physical or functional groupings (e.g., dual sensors, redundant power supplies) that are unfortunately negated by the higher-level OR logic connecting these groups.