## Line Chart: Accuracy vs. Time with Varying Parameters
### Overview
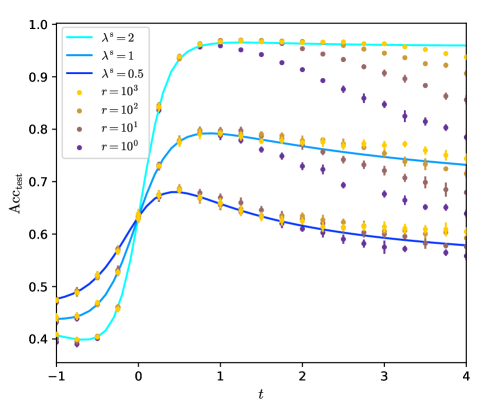
The image is a line chart that plots the test accuracy (Acc_test) against time (t) for different values of parameters lambda (λ^s) and r. The chart shows how the accuracy changes over time for different configurations of these parameters.
### Components/Axes
* **X-axis:** Time (t), ranging from -1 to 4.
* **Y-axis:** Test Accuracy (Acc_test), ranging from 0.4 to 1.0.
* **Legend (Top-Left):**
* Cyan: λ^s = 2
* Blue: λ^s = 1
* Dark Blue: λ^s = 0.5
* Yellow: r = 10^3
* Olive: r = 10^2
* Brown: r = 10^1
* Purple: r = 10^0
### Detailed Analysis
* **λ^s = 2 (Cyan):** The line starts at approximately 0.4 at t = -1, increases sharply to approximately 0.98 at t = 1, and then remains relatively constant around 0.98 until t = 4.
* **λ^s = 1 (Blue):** The line starts at approximately 0.42 at t = -1, increases sharply to approximately 0.8 at t = 1, and then decreases slightly to approximately 0.74 at t = 4.
* **λ^s = 0.5 (Dark Blue):** The line starts at approximately 0.4 at t = -1, increases to approximately 0.67 at t = 1, and then decreases to approximately 0.6 at t = 4.
* **r = 10^3 (Yellow):** The data points start at approximately 0.4 at t = -1, increase to approximately 0.7 at t = 1, and then fluctuate between 0.7 and 0.8 until t = 4.
* **r = 10^2 (Olive):** The data points start at approximately 0.4 at t = -1, increase to approximately 0.75 at t = 1, and then fluctuate between 0.75 and 0.85 until t = 4.
* **r = 10^1 (Brown):** The data points start at approximately 0.4 at t = -1, increase to approximately 0.8 at t = 1, and then fluctuate between 0.8 and 0.9 until t = 4.
* **r = 10^0 (Purple):** The data points start at approximately 0.4 at t = -1, increase to approximately 0.85 at t = 1, and then fluctuate between 0.85 and 0.95 until t = 4.
### Key Observations
* The lines representing different values of λ^s show a smooth transition, while the data points representing different values of r show more fluctuation.
* Higher values of λ^s generally lead to higher test accuracy.
* Higher values of r generally lead to higher test accuracy.
* The test accuracy increases sharply between t = -1 and t = 1 for all values of λ^s and r.
* The test accuracy tends to stabilize or slightly decrease after t = 1.
### Interpretation
The chart demonstrates the impact of parameters λ^s and r on the test accuracy of a model over time. The parameter λ^s appears to have a more consistent and predictable effect on the accuracy, as indicated by the smooth lines. The parameter r, on the other hand, shows more fluctuation in the accuracy, suggesting a less stable or more sensitive relationship. The initial increase in accuracy for all parameter values indicates a learning phase, while the subsequent stabilization or decrease suggests potential overfitting or diminishing returns. The higher accuracy achieved with larger λ^s and r values suggests that these parameters may be important for optimizing the model's performance.
```