## Line Chart: Ratios of the current Pareto front size for solving LOTZ
### Overview
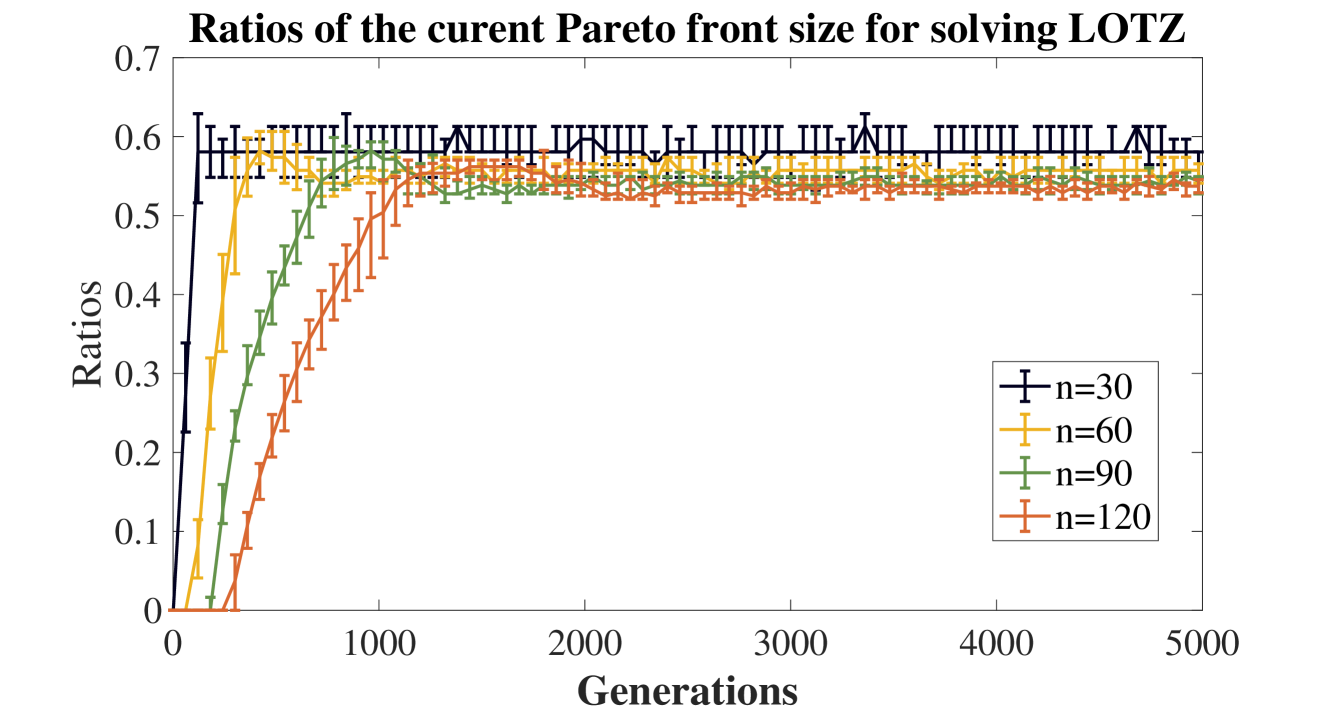
The image is a line chart that displays the ratios of the current Pareto front size for solving LOTZ (Leading Ones Trailing Zeros) problem across different generations. The chart compares the performance of four different configurations, denoted by 'n=30', 'n=60', 'n=90', and 'n=120'. The x-axis represents the number of generations, and the y-axis represents the ratios. Error bars are included on each data point.
### Components/Axes
* **Title:** Ratios of the current Pareto front size for solving LOTZ
* **X-axis:**
* Label: Generations
* Scale: 0 to 5000, with major ticks at 0, 1000, 2000, 3000, 4000, and 5000.
* **Y-axis:**
* Label: Ratios
* Scale: 0 to 0.7, with major ticks at 0, 0.1, 0.2, 0.3, 0.4, 0.5, 0.6, and 0.7.
* **Legend:** Located on the right side of the chart.
* n=30 (Black)
* n=60 (Yellow/Orange)
* n=90 (Green)
* n=120 (Orange/Brown)
### Detailed Analysis
* **n=30 (Black):** The line starts at approximately 0 at generation 0, rises sharply to approximately 0.55 by generation 100, and then plateaus around 0.58 with slight fluctuations and error bars.
* **n=60 (Yellow/Orange):** The line starts at approximately 0 at generation 0, rises sharply to approximately 0.55 by generation 500, and then plateaus around 0.56 with slight fluctuations and error bars.
* **n=90 (Green):** The line starts at approximately 0 at generation 0, rises sharply to approximately 0.55 by generation 1000, and then plateaus around 0.55 with slight fluctuations and error bars.
* **n=120 (Orange/Brown):** The line starts at approximately 0 at generation 0, rises sharply to approximately 0.55 by generation 1200, and then plateaus around 0.54 with slight fluctuations and error bars.
### Key Observations
* All four configurations show a similar trend: a rapid initial increase in the ratio, followed by a plateau.
* The 'n=30' configuration reaches its plateau the fastest, followed by 'n=60', 'n=90', and 'n=120'.
* The final ratios achieved by all configurations are relatively close, ranging from approximately 0.54 to 0.58.
* The error bars indicate some variability in the ratios across different runs or trials.
### Interpretation
The chart suggests that increasing the 'n' value (likely representing a parameter in the LOTZ problem) slows down the initial convergence of the Pareto front size ratio. However, the final ratios achieved are similar across all configurations. This indicates that while a smaller 'n' value leads to faster initial progress, it does not necessarily result in a significantly better final solution. The error bars suggest that the performance of each configuration can vary, highlighting the stochastic nature of the optimization process. The data demonstrates a trade-off between convergence speed and parameter configuration in solving the LOTZ problem.