## Line Chart: Ratios of the current Pareto front size for solving LOTZ
### Overview
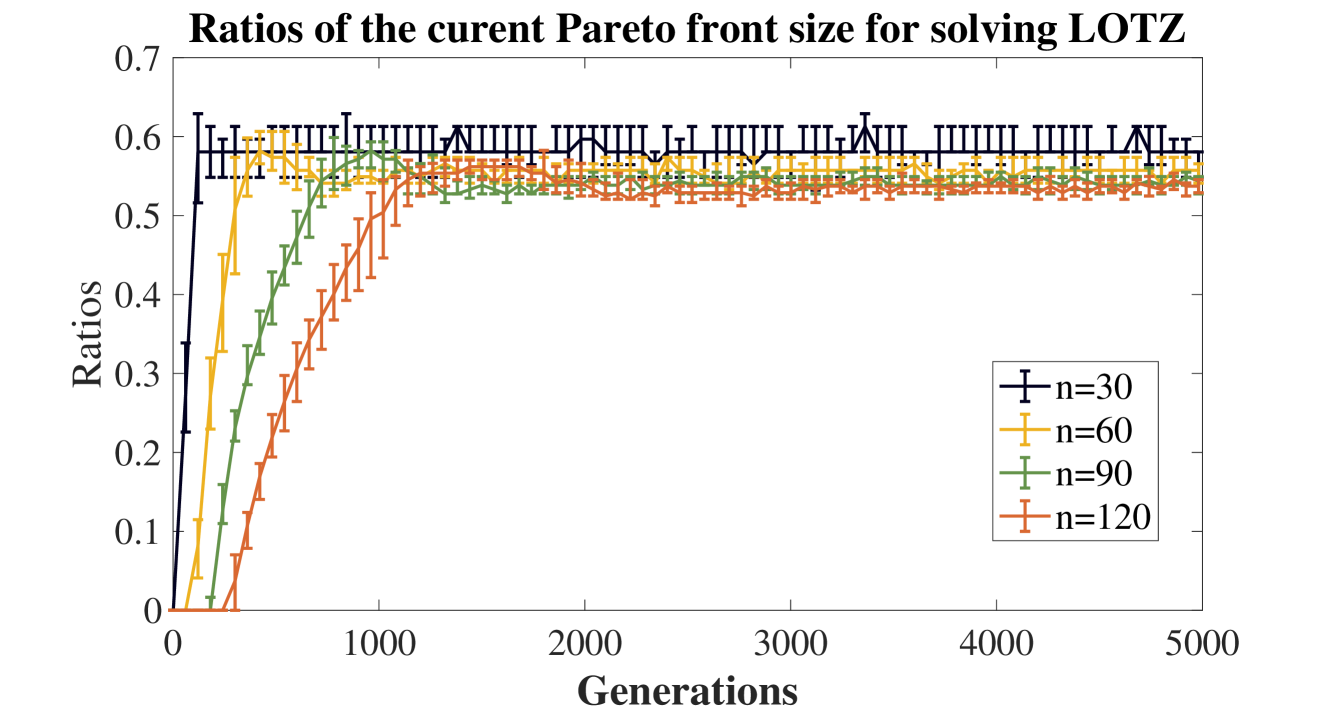
This chart displays the ratios of the current Pareto front size when solving the LOTZ problem, plotted against the number of generations. Four different lines represent different values of 'n' (30, 60, 90, and 120). Each data point is accompanied by an error bar, indicating the variability in the ratio.
### Components/Axes
* **Title:** "Ratios of the current Pareto front size for solving LOTZ" (centered at the top)
* **X-axis:** "Generations" (ranging from approximately 0 to 5000, labeled at the bottom)
* **Y-axis:** "Ratios" (ranging from approximately 0 to 0.7, labeled on the left)
* **Legend:** Located in the top-right corner, listing the values of 'n' and their corresponding line colors:
* n=30 (Black)
* n=60 (Orange)
* n=90 (Green)
* n=120 (Red)
### Detailed Analysis
The chart shows four lines, each representing a different 'n' value. All lines start at a ratio of 0 at generation 0, then increase. The lines then plateau at different levels.
* **n=30 (Black):** The line increases rapidly from 0 to approximately 0.58 at around 500 generations, then plateaus around 0.58-0.6 with some fluctuations. Error bars are relatively consistent throughout.
* **n=60 (Orange):** The line increases from 0 to approximately 0.55 at around 700 generations, then plateaus around 0.53-0.58 with some fluctuations. Error bars are relatively consistent throughout.
* **n=90 (Green):** The line increases from 0 to approximately 0.52 at around 900 generations, then plateaus around 0.51-0.56 with some fluctuations. Error bars are relatively consistent throughout.
* **n=120 (Red):** The line increases from 0 to approximately 0.48 at around 1100 generations, then plateaus around 0.49-0.54 with some fluctuations. Error bars are relatively consistent throughout.
**Approximate Data Points (reading from the chart):**
| Generations | n=30 (Black) | n=60 (Orange) | n=90 (Green) | n=120 (Red) |
|---|---|---|---|---|
| 0 | 0.0 | 0.0 | 0.0 | 0.0 |
| 250 | ~0.30 | ~0.25 | ~0.20 | ~0.15 |
| 500 | ~0.58 | ~0.55 | ~0.52 | ~0.48 |
| 1000 | ~0.60 | ~0.57 | ~0.54 | ~0.51 |
| 2000 | ~0.60 | ~0.56 | ~0.53 | ~0.50 |
| 3000 | ~0.60 | ~0.56 | ~0.53 | ~0.50 |
| 4000 | ~0.60 | ~0.56 | ~0.53 | ~0.50 |
| 5000 | ~0.60 | ~0.56 | ~0.53 | ~0.50 |
### Key Observations
* All lines exhibit a similar trend: an initial increase followed by a plateau.
* The plateau levels differ for each 'n' value, with n=30 consistently showing the highest ratio and n=120 the lowest.
* The error bars suggest that the ratios are relatively stable after the initial increase, with some variability.
* The rate of increase is fastest for n=30, and slowest for n=120.
### Interpretation
The chart demonstrates how the ratio of the current Pareto front size changes over generations for different values of 'n' when solving the LOTZ problem. The Pareto front represents a set of solutions that are non-dominated, meaning no solution is better in all objectives. The ratio indicates how well the algorithm is maintaining a diverse set of good solutions.
The fact that all lines plateau suggests that the algorithm converges to a stable state where further generations do not significantly improve the Pareto front size. The differences in plateau levels indicate that the value of 'n' influences the quality of the Pareto front. A higher 'n' (like 30) appears to result in a larger ratio, suggesting a more diverse and potentially better set of solutions. However, this might come at a computational cost.
The error bars provide a measure of the uncertainty in the ratios. The relatively small error bars suggest that the results are consistent and reliable. The initial increase in the ratio likely represents the algorithm discovering and adding new non-dominated solutions to the Pareto front. The subsequent plateau indicates that the algorithm is no longer finding significantly better solutions.