## Line Graph: Ratios of the current Pareto front size for solving LOTZ
### Overview
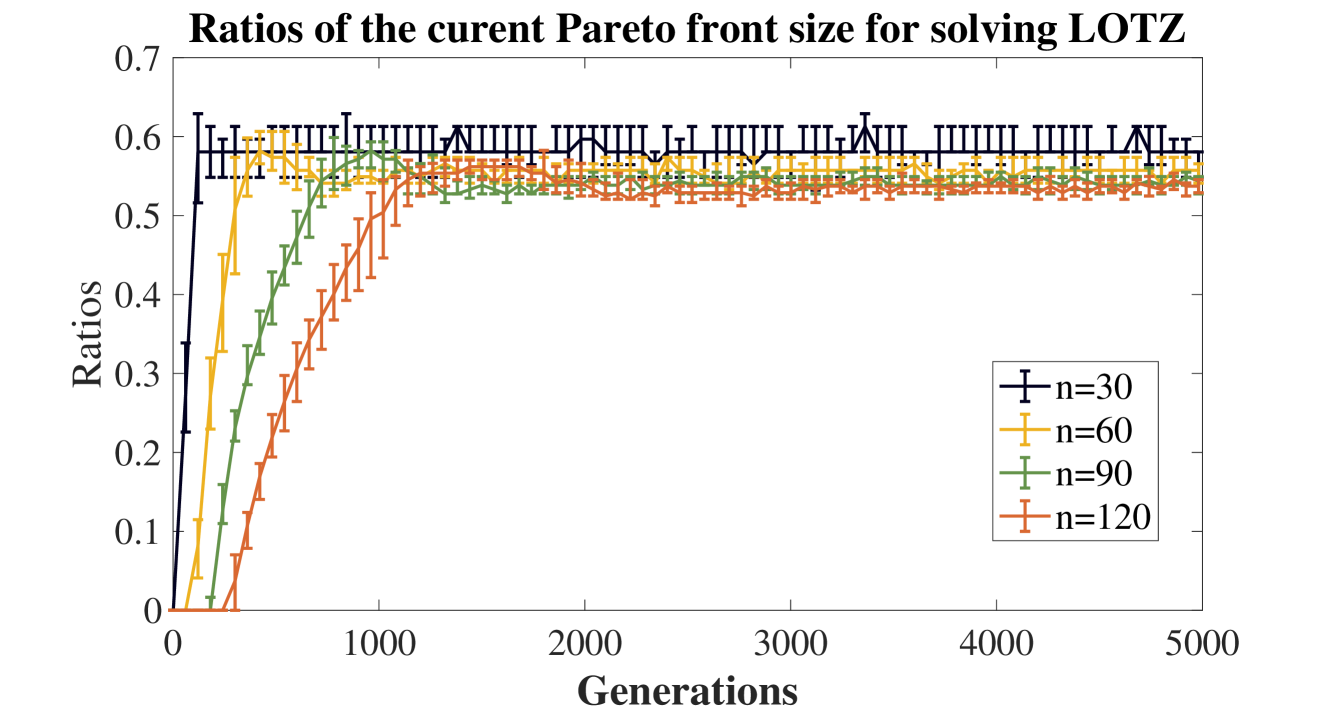
The graph depicts the evolution of Pareto front size ratios across generations for solving the LOTZ problem. Four data series represent different population sizes (`n=30`, `n=60`, `n=90`, `n=120`), showing how the ratio stabilizes over time. All lines exhibit a rapid initial increase followed by a plateau phase.
### Components/Axes
- **X-axis (Generations)**: Ranges from 0 to 5000 in increments of 1000.
- **Y-axis (Ratios)**: Scaled from 0 to 0.7 in increments of 0.1.
- **Legend**: Located in the bottom-right corner, mapping colors/markers to population sizes:
- Black triangles (`▲`): `n=30`
- Orange squares (`■`): `n=60`
- Green diamonds (`◇`): `n=90`
- Red crosses (`✖`): `n=120`
- **Error Bars**: Vertical error bars are present for all data points, indicating variability in measurements.
### Detailed Analysis
1. **Line Trends**:
- All lines start at 0 and rise sharply within the first 500 generations.
- After ~500 generations, all lines plateau at ratios between **0.55–0.6**, with minor fluctuations.
- **n=30** (black) and **n=60** (orange) reach the highest plateau values (~0.6).
- **n=90** (green) and **n=120** (red) plateau slightly lower (~0.55–0.57).
- Error bars are consistent across all lines, with no clear pattern in variability.
2. **Key Observations**:
- Higher population sizes (`n=90`, `n=120`) achieve lower plateau ratios compared to smaller populations (`n=30`, `n=60`).
- The initial steep increase is nearly identical across all `n` values.
- No line shows a decline after the plateau phase; all stabilize within the first 1000 generations.
- Error bars suggest measurement uncertainty but do not correlate with specific `n` values.
### Interpretation
The data suggests that increasing the population size (`n`) in solving LOTZ results in a marginally smaller Pareto front size ratio after convergence. This could imply that larger populations may explore the solution space more efficiently, leading to a tighter Pareto front. However, the plateau values for all `n` are relatively close (~0.55–0.6), indicating that population size has a limited impact on the final ratio. The consistent error bars across all lines suggest that variability in measurements is independent of population size. The rapid convergence within 1000 generations highlights the efficiency of the algorithm for this problem.