## Radar Charts: Loss Comparison for BAST-NSP and BAST-SP
### Overview
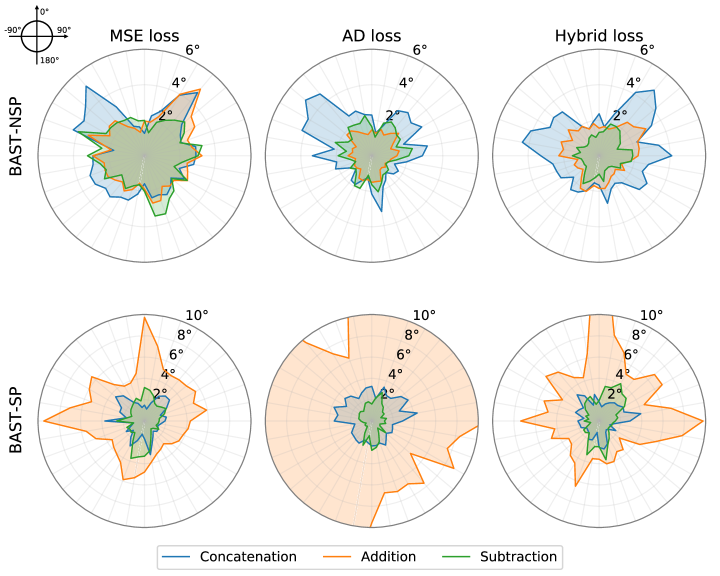
The image presents six radar charts comparing the performance of two models, BAST-NSP and BAST-SP, across three different loss functions: MSE loss, AD loss, and Hybrid loss. Each chart displays the angular error distribution using three different methods: Concatenation (blue), Addition (orange), and Subtraction (green). The radial axis represents the magnitude of the error in degrees.
### Components/Axes
* **Rows:**
* Top Row: BAST-NSP
* Bottom Row: BAST-SP
* **Columns:**
* Left Column: MSE loss
* Middle Column: AD loss
* Right Column: Hybrid loss
* **Radial Axis:** Error magnitude in degrees, ranging from 0° to 10°, with markers at 2°, 4°, 6°, 8°, and 10°.
* **Angular Axis:** Represents the angular distribution, marked with a compass rose in the top-left corner indicating 0°, 90°, and 180°.
* **Legend (bottom):**
* Blue: Concatenation
* Orange: Addition
* Green: Subtraction
### Detailed Analysis
**Top Row: BAST-NSP**
* **MSE loss:**
* Concatenation (blue): The error ranges approximately from 1° to 4°.
* Addition (orange): The error ranges approximately from 1° to 3°.
* Subtraction (green): The error ranges approximately from 0.5° to 2.5°.
* **AD loss:**
* Concatenation (blue): The error ranges approximately from 1° to 5°.
* Addition (orange): The error ranges approximately from 1° to 3°.
* Subtraction (green): The error ranges approximately from 0.5° to 2.5°.
* **Hybrid loss:**
* Concatenation (blue): The error ranges approximately from 1° to 6°.
* Addition (orange): The error ranges approximately from 1° to 3°.
* Subtraction (green): The error ranges approximately from 0.5° to 2.5°.
**Bottom Row: BAST-SP**
* **MSE loss:**
* Concatenation (blue): The error ranges approximately from 1° to 3°.
* Addition (orange): The error ranges approximately from 1° to 10°.
* Subtraction (green): The error ranges approximately from 0.5° to 2.5°.
* **AD loss:**
* Concatenation (blue): The error ranges approximately from 1° to 3°.
* Addition (orange): The error ranges approximately from 1° to 2°.
* Subtraction (green): The error ranges approximately from 0.5° to 2.5°.
* **Hybrid loss:**
* Concatenation (blue): The error ranges approximately from 1° to 3°.
* Addition (orange): The error ranges approximately from 1° to 8°.
* Subtraction (green): The error ranges approximately from 0.5° to 2.5°.
### Key Observations
* Subtraction consistently shows the lowest error across all loss functions and both models.
* Addition exhibits the highest error in the MSE loss and Hybrid loss for BAST-SP.
* Concatenation generally shows intermediate error levels.
* BAST-SP with MSE loss and Hybrid loss using Addition shows significantly higher error compared to other configurations.
### Interpretation
The radar charts provide a visual comparison of the angular error distributions for different model configurations. The consistent low error of the Subtraction method suggests it is a more robust approach for these models and loss functions. The high error observed with the Addition method for BAST-SP, particularly with MSE and Hybrid loss, indicates a potential instability or incompatibility between this model and loss function combination. The choice of loss function and the method (Concatenation, Addition, Subtraction) significantly impacts the model's performance, highlighting the importance of careful selection and tuning.