## Line Charts: Performance Comparison of Self-play against Majority Voting and Pass@N
### Overview
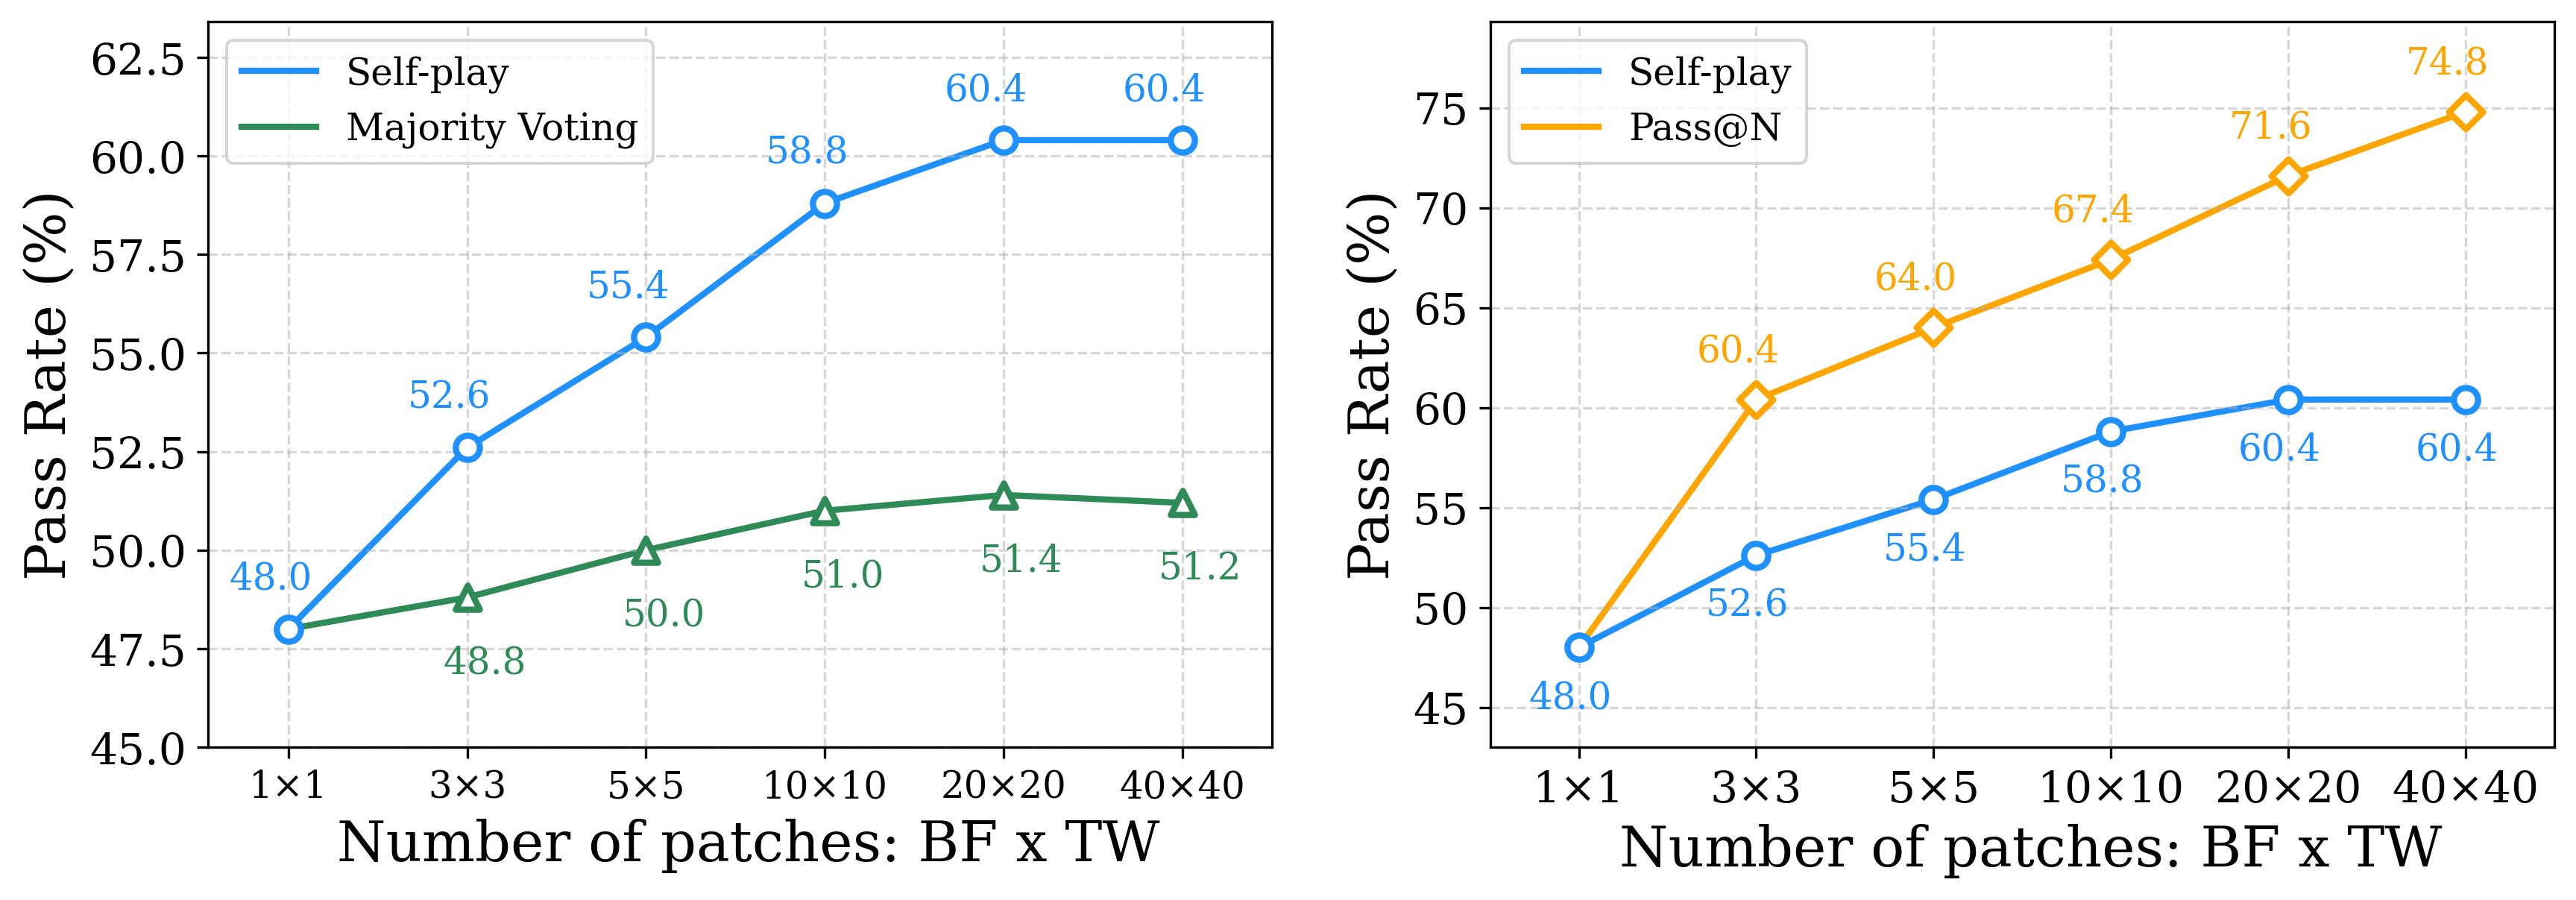
The image consists of two side-by-side line charts comparing the "Pass Rate (%)" of different evaluation or decoding strategies ("Self-play", "Majority Voting", and "Pass@N") as the "Number of patches: BF x TW" increases. The left chart compares Self-play to Majority Voting, while the right chart compares Self-play to Pass@N. Both charts demonstrate how scaling the number of generated patches affects the overall success rate.
### Components/Axes
**Shared Elements Across Both Charts:**
* **X-axis Title:** "Number of patches: BF x TW" (Located at the bottom center of each chart).
* **X-axis Categories (Markers):** Categorical progression labeled as `1x1`, `3x3`, `5x5`, `10x10`, `20x20`, and `40x40`.
* **Y-axis Title:** "Pass Rate (%)" (Located vertically on the left side of each chart).
* **Gridlines:** Both charts feature a light gray, dashed grid corresponding to the major y-axis ticks and x-axis categories.
**Left Chart Specifics:**
* **Y-axis Scale:** Ranges from 45.0 to 62.5, with major tick marks every 2.5 units (45.0, 47.5, 50.0, 52.5, 55.0, 57.5, 60.0, 62.5).
* **Legend (Top-Left):**
* Solid Blue Line: "Self-play"
* Solid Green Line: "Majority Voting"
**Right Chart Specifics:**
* **Y-axis Scale:** Ranges from 45 to 75, with major tick marks every 5 units (45, 50, 55, 60, 65, 70, 75).
* **Legend (Top-Left):**
* Solid Blue Line: "Self-play"
* Solid Orange/Yellow Line: "Pass@N"
---
### Detailed Analysis
#### Left Chart: Self-play vs. Majority Voting
* **Trend Verification:**
* The **Self-play** (blue line, circular markers) shows a strong, consistent upward slope from `1x1` to `20x20`, after which it completely plateaus, showing a flat horizontal line to `40x40`.
* The **Majority Voting** (green line, triangular markers) starts at the exact same origin point as Self-play but exhibits a very shallow, gradual upward slope, peaking at `20x20` before experiencing a very slight downward dip at `40x40`.
* **Data Points (Explicitly labeled in the image):**
* *Note: At `1x1`, both lines originate from the same node. The label "48.0" is printed in blue, but visually applies to both starting points.*
| Number of patches (X) | Self-play (Blue, Circles) | Majority Voting (Green, Triangles) |
| :--- | :--- | :--- |
| **1x1** | 48.0 (Label top-left of node) | ~48.0 (Shares origin node) |
| **3x3** | 52.6 (Label top-left of node) | 48.8 (Label below node) |
| **5x5** | 55.4 (Label top-left of node) | 50.0 (Label below node) |
| **10x10** | 58.8 (Label top-left of node) | 51.0 (Label below node) |
| **20x20** | 60.4 (Label above node) | 51.4 (Label below node) |
| **40x40** | 60.4 (Label above node) | 51.2 (Label below node) |
#### Right Chart: Self-play vs. Pass@N
* **Trend Verification:**
* The **Self-play** (blue line, circular markers) data is identical to the left chart, though visually flattened due to the expanded Y-axis scale. It slopes upward and plateaus at `20x20`.
* The **Pass@N** (orange line, diamond markers) starts at the same origin point but exhibits a steep, continuous upward slope across the entire x-axis, showing no signs of plateauing within the measured range.
* **Data Points (Explicitly labeled in the image):**
* *Note: At `1x1`, both lines originate from the same node. The label "48.0" is printed in blue below the node.*
| Number of patches (X) | Self-play (Blue, Circles) | Pass@N (Orange, Diamonds) |
| :--- | :--- | :--- |
| **1x1** | 48.0 (Label below node) | ~48.0 (Shares origin node) |
| **3x3** | 52.6 (Label below node) | 60.4 (Label above node) |
| **5x5** | 55.4 (Label below node) | 64.0 (Label above node) |
| **10x10** | 58.8 (Label below node) | 67.4 (Label above node) |
| **20x20** | 60.4 (Label below node) | 71.6 (Label above node) |
| **40x40** | 60.4 (Label below node) | 74.8 (Label above node) |
---
### Key Observations
1. **Origin Point:** All three methodologies (Self-play, Majority Voting, Pass@N) begin at a baseline pass rate of 48.0% when the patch configuration is `1x1`.
2. **The Plateau Effect:** The "Self-play" method scales well initially but hits a hard ceiling at `20x20`, showing zero improvement (remaining at 60.4%) when doubling the patches to `40x40`.
3. **Underperformance of Majority Voting:** Majority Voting scales very poorly compared to the other methods. Increasing the patches from `1x1` to `40x40` only yields a marginal 3.2% absolute improvement (48.0% to 51.2%), and actually degrades slightly from `20x20` to `40x40`.
4. **Theoretical Maximum (Pass@N):** Pass@N scales aggressively and continuously. At `40x40`, it reaches 74.8%, creating a massive 14.4% gap between it and the Self-play method.
### Interpretation
These charts likely represent the evaluation of a Large Language Model (LLM) on a reasoning or coding benchmark (implied by "Pass Rate" and "Pass@N"). "Number of patches: BF x TW" likely refers to a search or sampling strategy (e.g., Branching Factor x Tree Width) used to generate multiple candidate solutions.
* **Reading between the lines:**
* **Pass@N** represents the "Oracle" upper bound—if the model generates $N$ answers, what is the probability that *at least one* is correct? The steep rise in the orange line proves that the underlying model *is capable* of generating the correct answer if given enough attempts; the correct answer is in the pool of generated patches 74.8% of the time at `40x40`.
* **Majority Voting** is failing because the model likely generates a high volume of consistent, but *incorrect*, answers. Even if the correct answer is in the pool (as proven by Pass@N), the incorrect answers outnumber it, causing the vote to fail.
* **Self-play** (likely a method where the model evaluates its own generated answers to pick the best one) is vastly superior to Majority Voting. It successfully identifies the correct answer from the pool up to a point. However, the hard plateau at 60.4% reveals a critical limitation in the Self-play reward model or discriminator: once the pool of answers gets too large (`20x20` and beyond), the Self-play mechanism loses its ability to distinguish the correct answer from highly plausible incorrect answers.
* **The "Selection Gap":** The most crucial takeaway is the widening gap in the right chart. At `40x40`, the model generates the correct answer 74.8% of the time, but the Self-play selection mechanism can only find it 60.4% of the time. This indicates that future research should focus not on generating *more* answers, but on improving the *selection/filtering* mechanism to close the gap between Self-play and Pass@N.