## Line Charts: Pass Rate vs. Number of Patches
### Overview
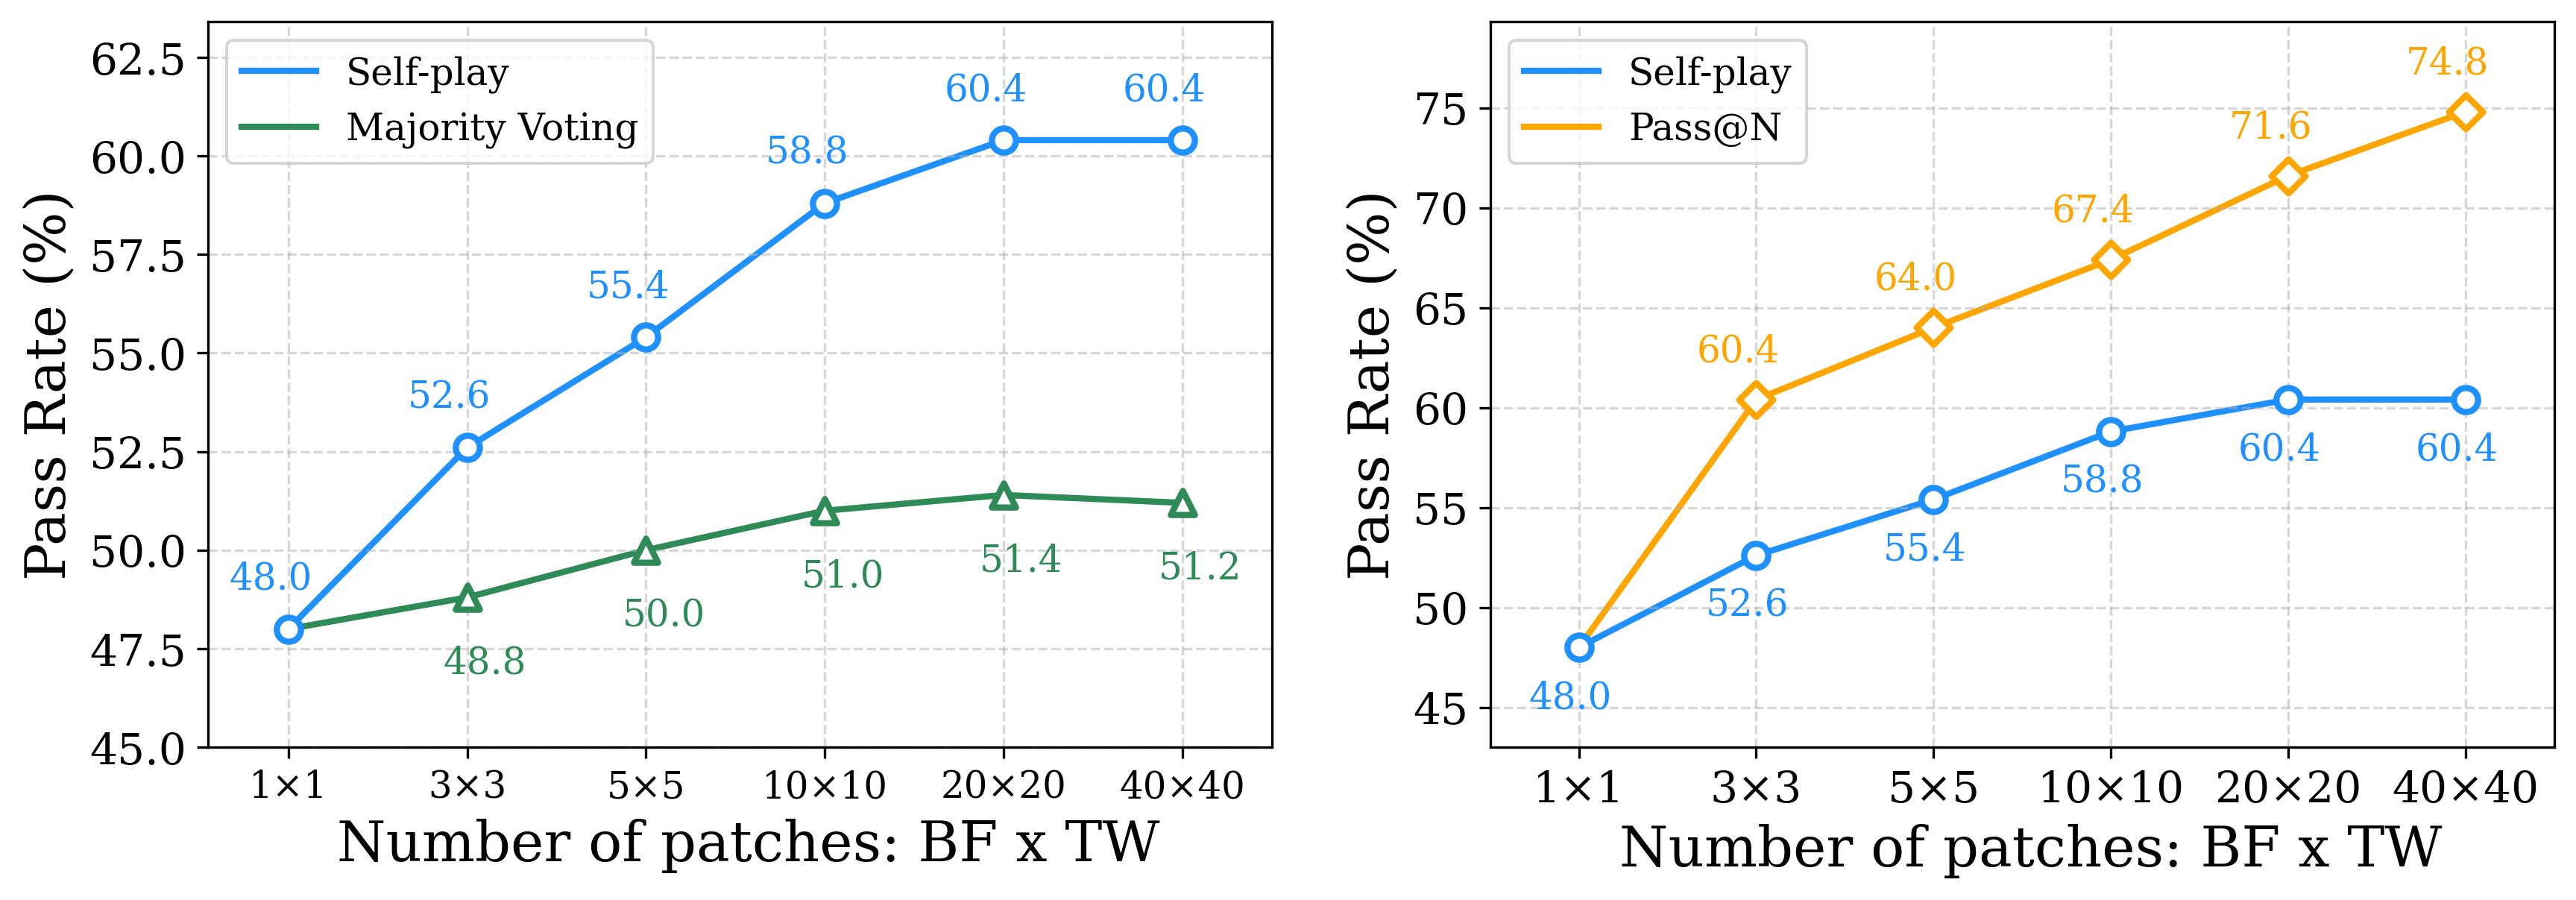
The image contains two line charts comparing the pass rate (%) against the number of patches (BF x TW) for different methods. The left chart compares "Self-play" and "Majority Voting", while the right chart compares "Self-play" and "Pass@N". The x-axis represents the number of patches, and the y-axis represents the pass rate in percentage.
### Components/Axes
**Left Chart:**
* **Title:** Implicitly, Pass Rate vs. Number of Patches for Self-play and Majority Voting
* **X-axis:**
* Label: "Number of patches: BF x TW"
* Scale: Categorical, with values "1x1", "3x3", "5x5", "10x10", "20x20", "40x40"
* **Y-axis:**
* Label: "Pass Rate (%)"
* Scale: Numerical, ranging from 45.0 to 62.5, with increments of 2.5.
* **Legend:** Located in the top-left corner.
* "Self-play" (blue line with circle markers)
* "Majority Voting" (green line with triangle markers)
**Right Chart:**
* **Title:** Implicitly, Pass Rate vs. Number of Patches for Self-play and Pass@N
* **X-axis:**
* Label: "Number of patches: BF x TW"
* Scale: Categorical, with values "1x1", "3x3", "5x5", "10x10", "20x20", "40x40"
* **Y-axis:**
* Label: "Pass Rate (%)"
* Scale: Numerical, ranging from 45 to 75, with increments of 5.
* **Legend:** Located in the top-left corner.
* "Self-play" (blue line with circle markers)
* "Pass@N" (orange line with diamond markers)
### Detailed Analysis
**Left Chart:**
* **Self-play (blue line):** The pass rate generally increases as the number of patches increases, then plateaus.
* 1x1: 48.0%
* 3x3: 52.6%
* 5x5: 55.4%
* 10x10: 58.8%
* 20x20: 60.4%
* 40x40: 60.4%
* **Majority Voting (green line):** The pass rate increases slightly and then remains relatively stable.
* 1x1: 48.8%
* 3x3: 50.0%
* 5x5: 51.0%
* 10x10: 51.4%
* 20x20: 51.2%
**Right Chart:**
* **Self-play (blue line):** The pass rate increases as the number of patches increases, then plateaus.
* 1x1: 48.0%
* 3x3: 52.6%
* 5x5: 55.4%
* 10x10: 58.8%
* 20x20: 60.4%
* 40x40: 60.4%
* **Pass@N (orange line):** The pass rate consistently increases as the number of patches increases.
* 1x1: 60.4%
* 3x3: 64.0%
* 5x5: 67.4%
* 10x10: 71.6%
* 20x20: 74.8%
### Key Observations
* In both charts, the "Self-play" method shows an increasing pass rate initially, but it plateaus after a certain number of patches (20x20).
* "Pass@N" consistently outperforms "Self-play" and "Majority Voting" as the number of patches increases.
* "Majority Voting" shows a relatively flat pass rate across different numbers of patches.
### Interpretation
The data suggests that increasing the number of patches (BF x TW) generally improves the pass rate for all methods, up to a point. "Pass@N" demonstrates the most significant improvement with increasing patches, indicating it may be more effective at leveraging information from larger patch sizes. "Self-play" benefits from increased patch sizes initially, but its performance plateaus, suggesting a diminishing return. "Majority Voting" appears less sensitive to the number of patches, maintaining a relatively stable pass rate. The choice of method and patch size should be considered based on the desired performance and computational cost.