\n
## Line Chart: Pass Rate vs. Number of Patches
### Overview
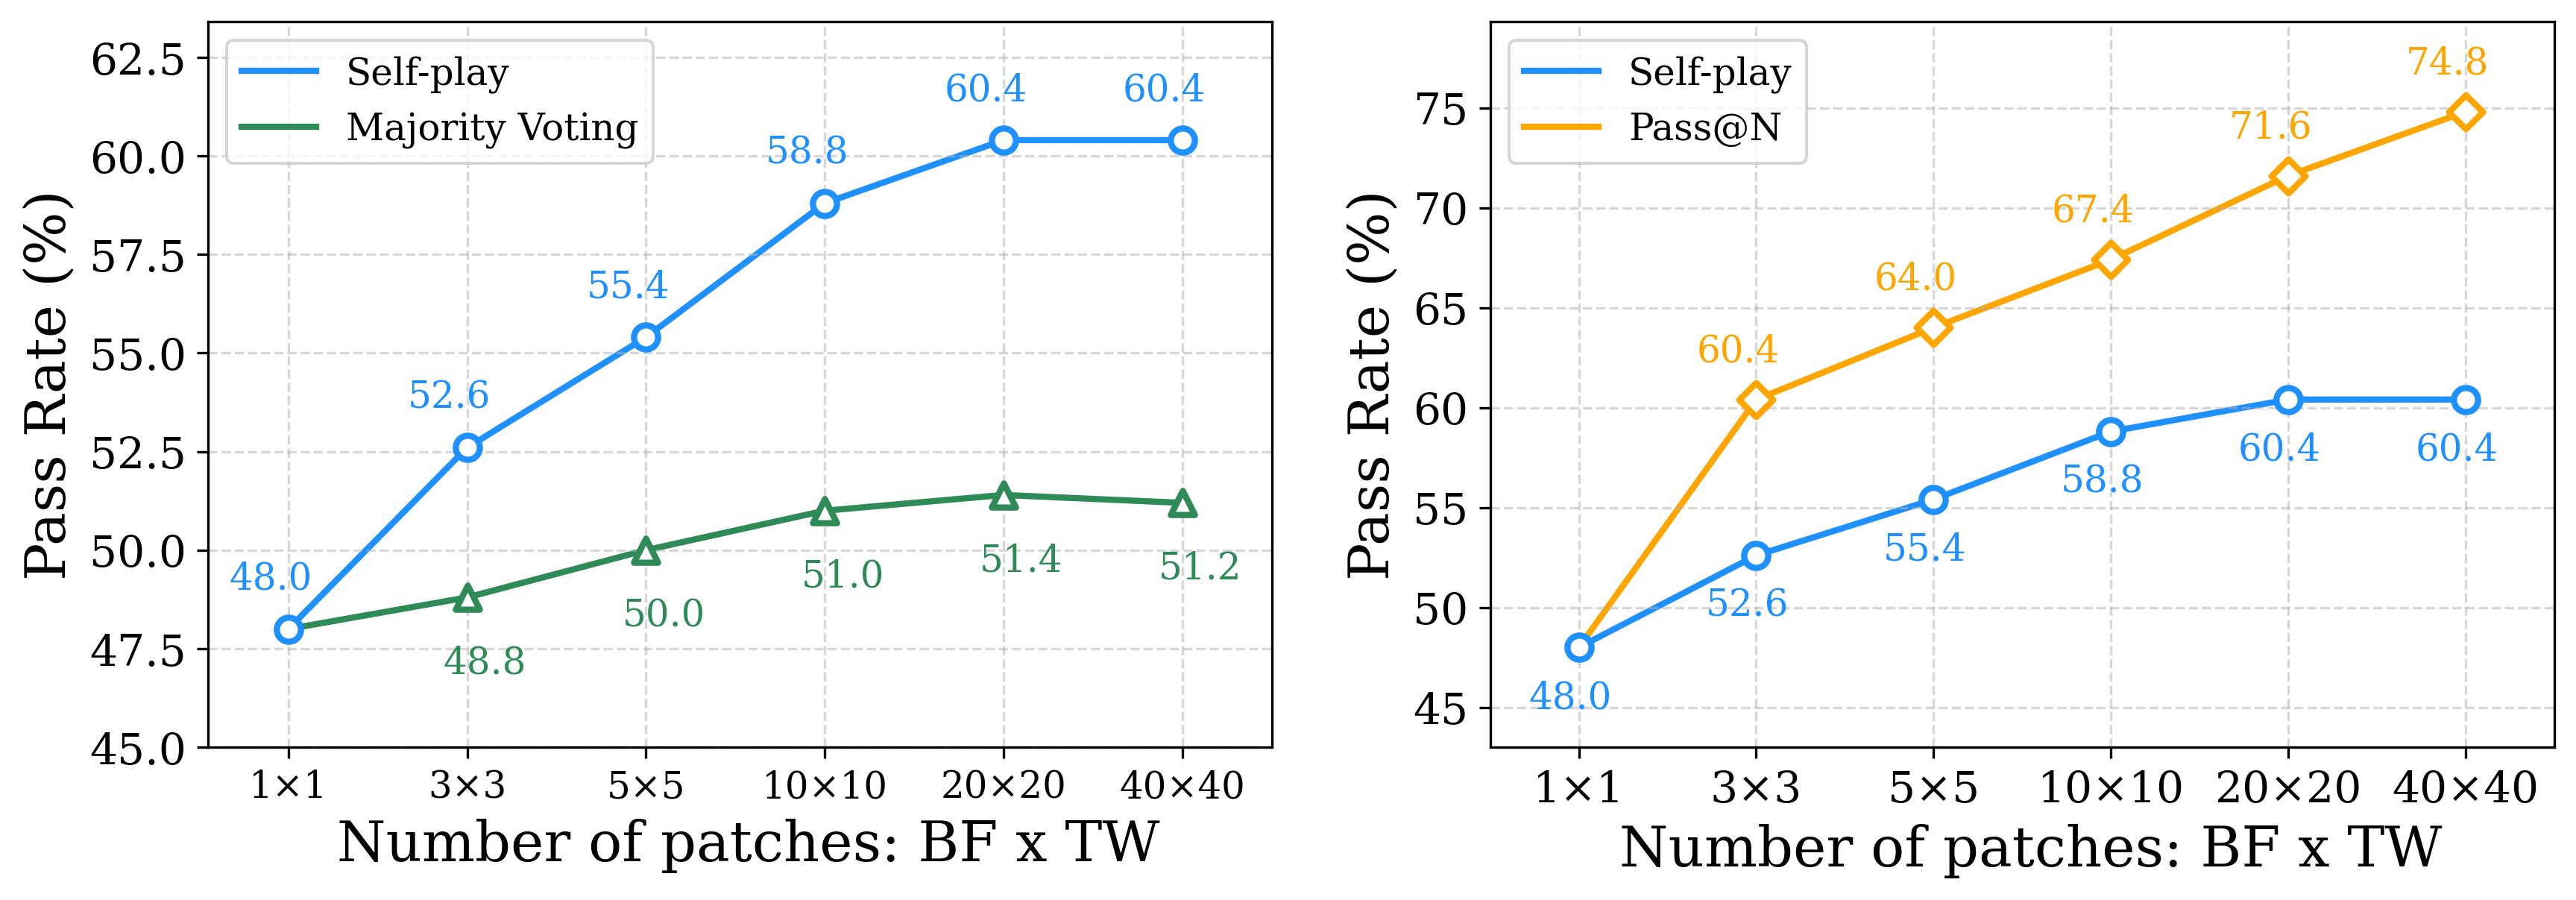
The image presents two line charts comparing the "Pass Rate (%)" of two methods, "Self-play" and "Pass@N" (or "Majority Voting" in the left chart), across different "Number of patches: BF x TW" configurations. The x-axis represents the number of patches, with values 1x1, 3x3, 5x5, 10x10, 20x20, and 40x40. The y-axis represents the Pass Rate, ranging from 45% to 75%.
### Components/Axes
* **X-axis Label:** "Number of patches: BF x TW"
* **Y-axis Label:** "Pass Rate (%)"
* **Left Chart Legend:**
* Blue Line: "Self-play"
* Green Line: "Majority Voting"
* **Right Chart Legend:**
* Blue Line: "Self-play"
* Orange Line: "Pass@N"
* **X-axis Markers:** 1x1, 3x3, 5x5, 10x10, 20x20, 40x40
* **Y-axis Markers:** 45.0, 47.5, 50.0, 52.5, 55.0, 57.5, 60.0, 62.5 (Left Chart), 45.0, 48.0, 50.0, 52.5, 55.0, 57.5, 60.0, 62.5, 65.0, 67.5, 70.0, 72.5, 75.0 (Right Chart)
### Detailed Analysis or Content Details
**Left Chart: Majority Voting vs. Self-play**
* **Self-play (Blue Line):** The line slopes upward initially, then plateaus.
* 1x1: ~48.0%
* 3x3: ~52.6%
* 5x5: ~55.4%
* 10x10: ~58.8%
* 20x20: ~60.4%
* 40x40: ~60.4%
* **Majority Voting (Green Line):** The line initially increases, then decreases and plateaus.
* 1x1: ~48.8%
* 3x3: ~50.0%
* 5x5: ~51.0%
* 10x10: ~51.4%
* 20x20: ~51.2%
* 40x40: ~51.2%
**Right Chart: Pass@N vs. Self-play**
* **Self-play (Blue Line):** The line slopes upward initially, then plateaus.
* 1x1: ~48.0%
* 3x3: ~52.6%
* 5x5: ~55.4%
* 10x10: ~58.8%
* 20x20: ~60.4%
* 40x40: ~60.4%
* **Pass@N (Orange Line):** The line slopes upward consistently.
* 1x1: ~48.0%
* 3x3: ~60.4%
* 5x5: ~64.0%
* 10x10: ~67.4%
* 20x20: ~71.6%
* 40x40: ~74.8%
### Key Observations
* In both charts, the "Self-play" method shows diminishing returns as the number of patches increases, plateauing around 60%.
* The "Majority Voting" method (left chart) performs poorly compared to "Self-play" and plateaus at a lower pass rate.
* The "Pass@N" method (right chart) consistently outperforms "Self-play" and shows a positive correlation between the number of patches and the pass rate.
* The "Pass@N" method demonstrates a significant improvement in pass rate as the number of patches increases, suggesting that more patches lead to better performance.
### Interpretation
The data suggests that increasing the number of patches (BF x TW) generally improves the pass rate for both methods, but the effect is more pronounced for the "Pass@N" method. The "Pass@N" method appears to be a more effective strategy than "Majority Voting" and eventually outperforms "Self-play" as the number of patches increases. The plateauing of the "Self-play" method indicates that there is a limit to its improvement with more patches, while "Pass@N" continues to benefit. This could be due to the "Pass@N" method's ability to leverage information from multiple patches more effectively. The initial similar performance of both methods at 1x1 suggests that the benefit of the "Pass@N" method is only realized with a larger patch size. The consistent upward trend of "Pass@N" suggests that further increasing the number of patches could lead to even higher pass rates.