# Technical Document Extraction: Line Chart Analysis
## 1. Axis Labels and Markers
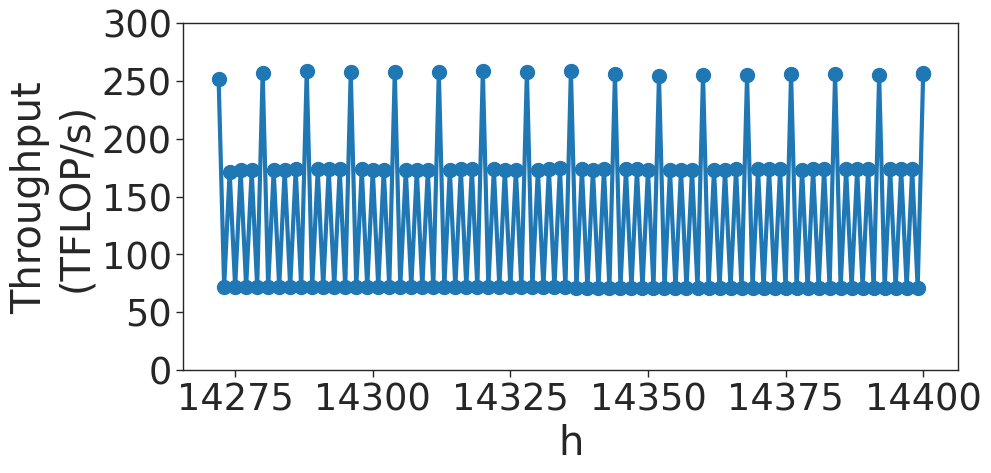
- **Y-Axis**:
- Label: `Throughput (TFLOP/s)`
- Range: `0` to `300`
- Increment: `50` (visible grid lines at 0, 50, 100, 150, 200, 250, 300)
- **X-Axis**:
- Label: `h`
- Range: `14275` to `14400`
- Increment: `25` (values at 14275, 14300, 14325, 14350, 14375, 14400)
## 2. Legend
- **Position**: Top-right corner of the chart
- **Label**: `Throughput`
- **Color**: Blue (matches all data points and connecting lines)
## 3. Data Points and Trends
- **X-Axis Values**:
- Data points are plotted at intervals of `25` (e.g., 14275, 14300, 14325, ..., 14400).
- **Y-Axis Behavior**:
- **Peaks**: Consistent at approximately `250 TFLOP/s` for all data points.
- **Troughs**: Consistent at approximately `175 TFLOP/s` for all data points.
- **Visual Trend**:
- The line exhibits a **repeating sinusoidal pattern** with peaks and troughs.
- No deviation from the pattern across the x-axis range.
## 4. Component Isolation
- **Header**: No explicit header text.
- **Main Chart**:
- Blue line with circular markers (dots) at each data point.
- Grid lines for both axes to aid readability.
- **Footer**: No footer text.
## 5. Spatial Grounding
- **Legend Placement**: Top-right corner (standard for line charts).
- **Data Point Alignment**:
- All blue dots and connecting lines align with the x-axis increments.
## 6. Key Observations
- The chart represents a **stable oscillatory throughput** over the x-axis range (`h`).
- No anomalies or outliers detected in the data series.
- The pattern suggests a **periodic process** (e.g., batch processing, cyclic workload).
## 7. Missing Elements
- No additional legends, annotations, or textual data present.
- No secondary y-axis or secondary data series.
## 8. Conclusion
The chart depicts a **consistent, periodic throughput pattern** with no variation in amplitude or frequency across the observed range of `h`.