## Line Chart: Training Batch Accuracy (%)
### Overview
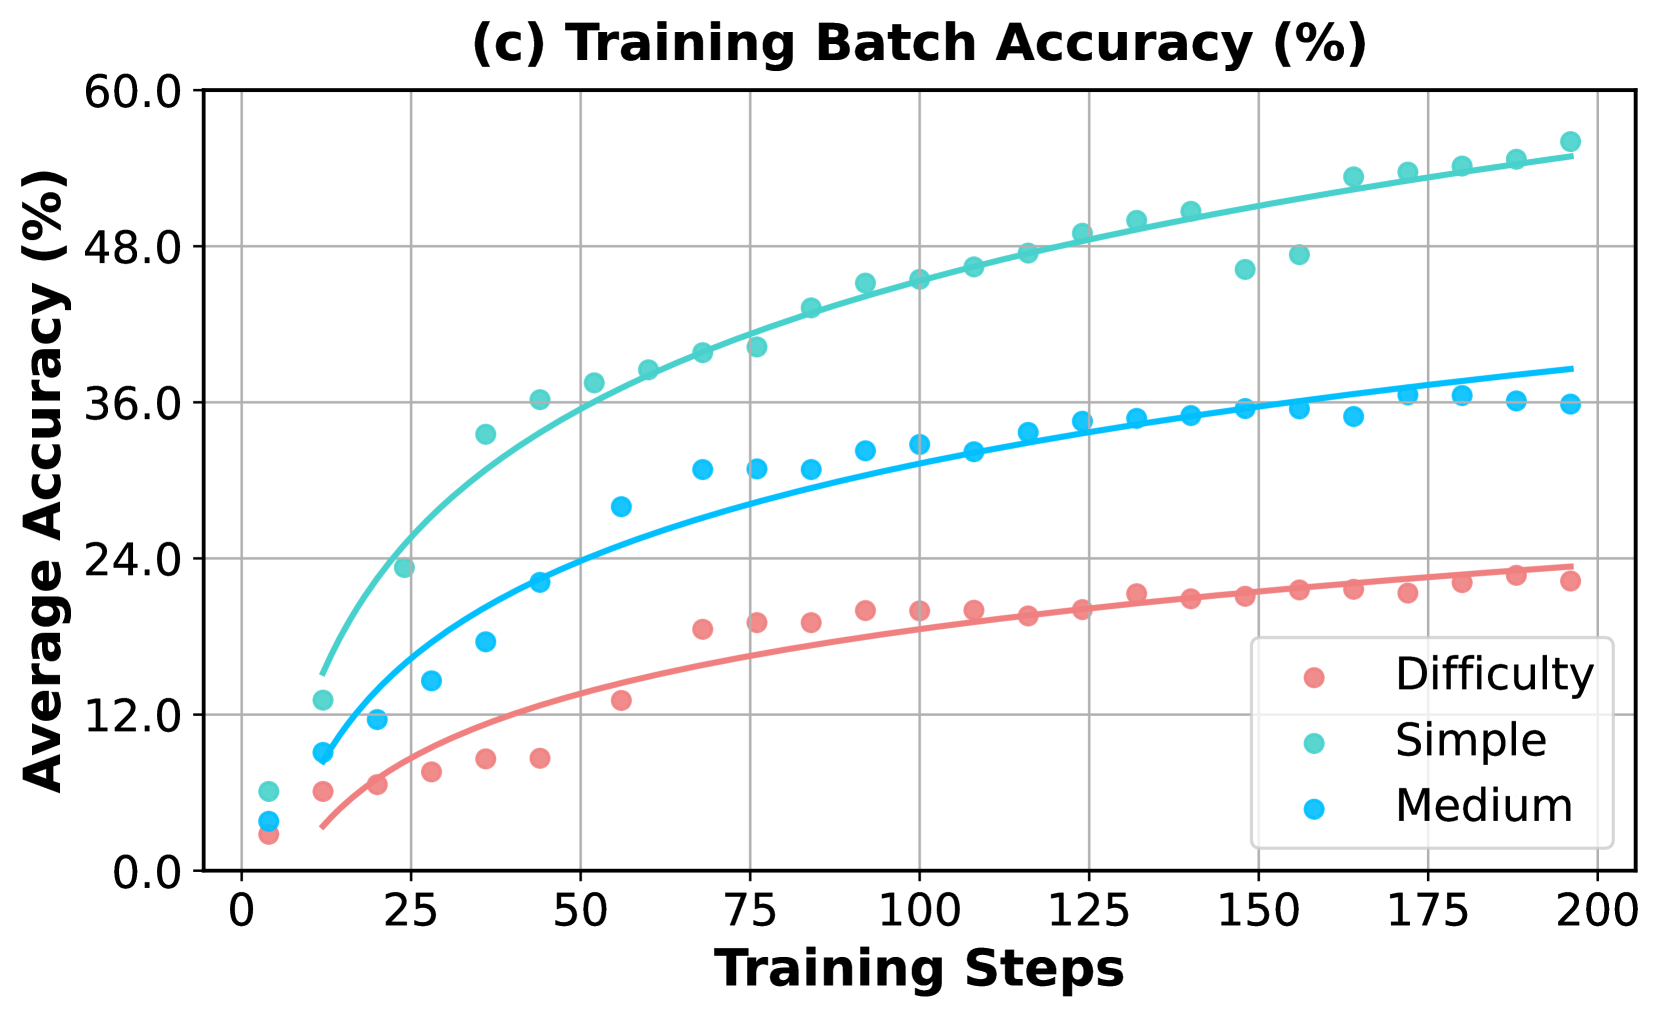
The image is a line chart comparing the training batch accuracy (%) over training steps for three different difficulty levels: Difficulty, Simple, and Medium. The chart displays how the average accuracy changes as the training progresses, with each difficulty level represented by a different colored line and data points.
### Components/Axes
* **Title:** (c) Training Batch Accuracy (%)
* **X-axis:** Training Steps, ranging from 0 to 200 in increments of 25.
* **Y-axis:** Average Accuracy (%), ranging from 0.0 to 60.0 in increments of 12.0.
* **Legend:** Located in the bottom-right corner, it identifies the three difficulty levels:
* Difficulty (lightcoral)
* Simple (turquoise)
* Medium (deepskyblue)
### Detailed Analysis
* **Difficulty (lightcoral):** The line starts at approximately 2.0% accuracy at 0 training steps and gradually increases to around 20.0% accuracy at 200 training steps. The trend is generally upward, with a steeper initial increase that plateaus as the training steps increase.
* At 0 Training Steps: ~2.0%
* At 25 Training Steps: ~8.0%
* At 50 Training Steps: ~12.0%
* At 75 Training Steps: ~15.0%
* At 100 Training Steps: ~17.0%
* At 125 Training Steps: ~18.0%
* At 150 Training Steps: ~19.0%
* At 175 Training Steps: ~20.0%
* At 200 Training Steps: ~20.0%
* **Simple (turquoise):** The line starts at approximately 5.0% accuracy at 0 training steps and increases to around 55.0% accuracy at 200 training steps. The trend is upward, with a rapid initial increase that slows down as the training steps increase.
* At 0 Training Steps: ~5.0%
* At 25 Training Steps: ~25.0%
* At 50 Training Steps: ~35.0%
* At 75 Training Steps: ~42.0%
* At 100 Training Steps: ~45.0%
* At 125 Training Steps: ~48.0%
* At 150 Training Steps: ~50.0%
* At 175 Training Steps: ~53.0%
* At 200 Training Steps: ~55.0%
* **Medium (deepskyblue):** The line starts at approximately 4.0% accuracy at 0 training steps and increases to around 36.0% accuracy at 200 training steps. The trend is upward, with a rapid initial increase that slows down as the training steps increase.
* At 0 Training Steps: ~4.0%
* At 25 Training Steps: ~15.0%
* At 50 Training Steps: ~22.0%
* At 75 Training Steps: ~27.0%
* At 100 Training Steps: ~30.0%
* At 125 Training Steps: ~32.0%
* At 150 Training Steps: ~34.0%
* At 175 Training Steps: ~35.0%
* At 200 Training Steps: ~36.0%
### Key Observations
* The "Simple" difficulty level consistently shows the highest accuracy throughout the training process.
* The "Difficulty" level has the lowest accuracy, indicating it is the most challenging for the model to learn.
* All three difficulty levels exhibit a diminishing rate of increase in accuracy as the training steps increase, suggesting a convergence towards a maximum achievable accuracy for each level.
### Interpretation
The chart illustrates the learning curves for different difficulty levels during the training of a model. The "Simple" difficulty level achieves the highest accuracy, indicating that the model learns these patterns most effectively. The "Difficulty" level's lower accuracy suggests that the model struggles to learn the complex patterns associated with this level. The "Medium" difficulty level falls in between, showing a moderate learning curve. The diminishing increase in accuracy over time suggests that the model is approaching its maximum performance for each difficulty level, and further training may yield only marginal improvements. This information can be used to optimize the training process, potentially by focusing on the "Difficulty" level or adjusting the training parameters to improve overall performance.