## Line Chart: Model Accuracy vs. Epochs
### Overview
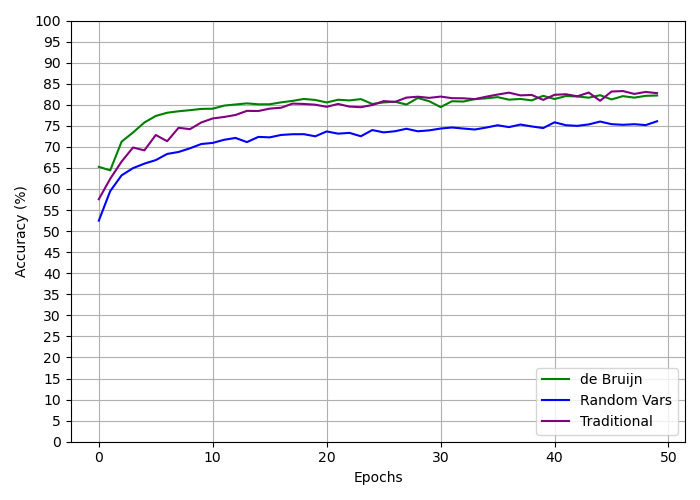
The image is a line chart comparing the accuracy of three different models ("de Bruijn", "Random Vars", and "Traditional") over 50 epochs. The chart displays the accuracy percentage on the y-axis and the number of epochs on the x-axis.
### Components/Axes
* **X-axis:** Epochs, labeled from 0 to 50 in increments of 10.
* **Y-axis:** Accuracy (%), labeled from 0 to 100 in increments of 5.
* **Gridlines:** Present on both axes, aiding in value estimation.
* **Legend:** Located in the bottom-right corner, identifying each model by color:
* Green: "de Bruijn"
* Dark Blue: "Random Vars"
* Purple: "Traditional"
### Detailed Analysis
* **de Bruijn (Green):**
* Trend: Initially increases rapidly, then plateaus around 80-83% after approximately 10 epochs.
* Approximate Values:
* Epoch 0: ~58%
* Epoch 5: ~75%
* Epoch 10: ~79%
* Epoch 50: ~82%
* **Random Vars (Dark Blue):**
* Trend: Increases rapidly initially, then plateaus around 73-76% after approximately 20 epochs.
* Approximate Values:
* Epoch 0: ~52%
* Epoch 5: ~68%
* Epoch 10: ~72%
* Epoch 50: ~75%
* **Traditional (Purple):**
* Trend: Increases rapidly initially, then plateaus around 80-83% after approximately 15 epochs.
* Approximate Values:
* Epoch 0: ~57%
* Epoch 5: ~70%
* Epoch 10: ~77%
* Epoch 50: ~83%
### Key Observations
* All three models show a rapid increase in accuracy during the initial epochs.
* The "de Bruijn" and "Traditional" models achieve similar accuracy levels, slightly outperforming the "Random Vars" model.
* The "Random Vars" model plateaus at a lower accuracy compared to the other two.
* After the initial increase, all models exhibit relatively stable accuracy with minor fluctuations.
### Interpretation
The chart demonstrates the learning curves of three different models. The "de Bruijn" and "Traditional" models converge to a higher accuracy level compared to the "Random Vars" model, suggesting they may be better suited for the task. The rapid initial increase in accuracy for all models indicates effective learning during the early epochs. The plateauing suggests that further training beyond a certain number of epochs may not significantly improve the accuracy of these models. The similar performance of "de Bruijn" and "Traditional" suggests they may share similar underlying mechanisms or be optimized for similar features in the data.