## Mathematical Problem Analysis: Derivative Comparison
### Overview
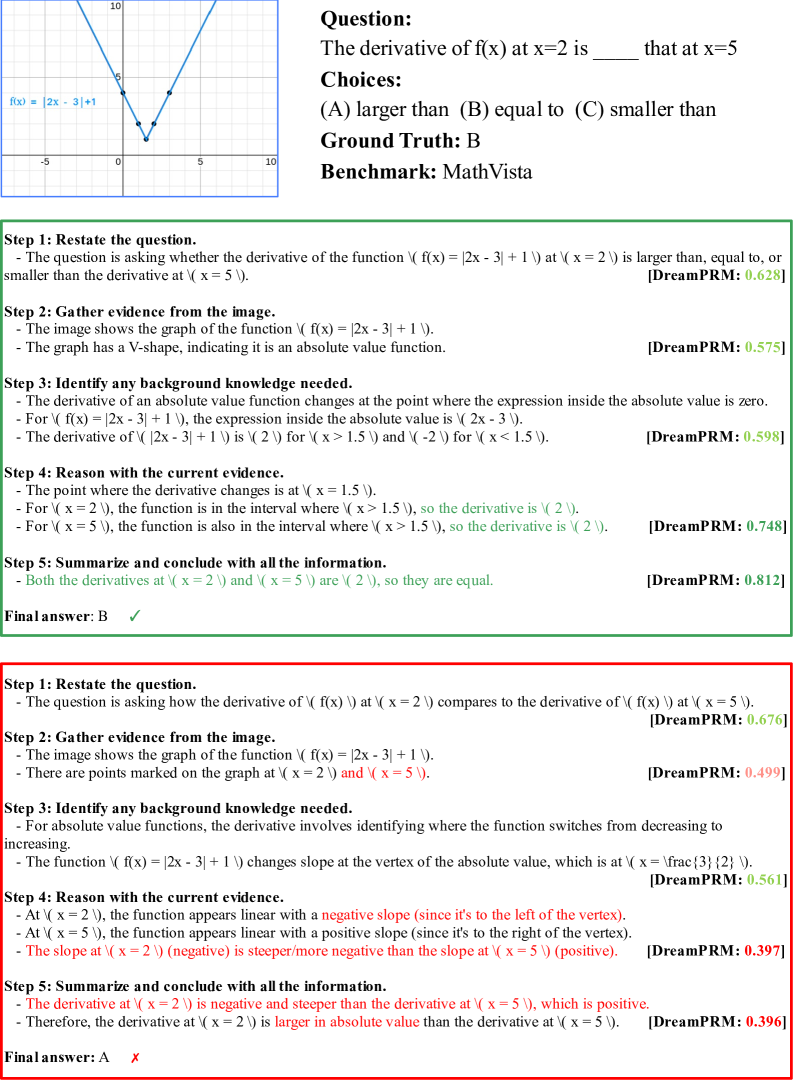
The image presents a mathematical problem involving the comparison of derivatives of an absolute value function at two specific points. It includes a graph of the function, the problem statement with multiple-choice answers, the ground truth answer, and two distinct step-by-step solution attempts with confidence scores. The image serves as an educational or benchmarking tool, likely from a dataset like "MathVista," to evaluate reasoning about calculus concepts.
### Components/Axes
**1. Graph (Top-Left Quadrant):**
* **Function:** `f(x) = |2x - 3| + 1`
* **Graph Type:** A V-shaped graph characteristic of an absolute value function.
* **Axes:**
* **X-axis:** Labeled with numerical markers at -5, 0, 5, and 10.
* **Y-axis:** Labeled with numerical markers at 0, 5, and 10.
* **Key Points:** Two points are explicitly marked with blue dots on the graph:
* One point is located at approximately `(2, 2)`.
* Another point is located at approximately `(5, 8)`.
* **Vertex:** The vertex (minimum point) of the V-shape is at `(1.5, 1)`.
**2. Problem Statement (Top-Right Quadrant):**
* **Question:** "The derivative of f(x) at x=2 is ______ that at x=5"
* **Choices:**
* (A) larger than
* (B) equal to
* (C) smaller than
* **Ground Truth:** B
* **Benchmark:** MathVista
**3. Solution Attempt 1 (Middle Box - Green Border):**
* **Title:** "Step 1: Restate the question." through "Step 5: Summarize and conclude..."
* **Content:** A five-step reasoning process concluding that the derivatives are equal.
* **Final Answer:** "Final answer: B ✓" (with a green checkmark).
* **Confidence Scores:** Each step is followed by a `[DreamPRM: X.XXX]` score in green text, ranging from 0.575 to 0.812.
**4. Solution Attempt 2 (Bottom Box - Red Border):**
* **Title:** "Step 1: Restate the question." through "Step 5: Summarize and conclude..."
* **Content:** A five-step reasoning process concluding that the derivative at x=2 is larger (in absolute value) than at x=5.
* **Final Answer:** "Final answer: A ✗" (with a red cross).
* **Confidence Scores:** Each step is followed by a `[DreamPRM: X.XXX]` score in red text, ranging from 0.396 to 0.676.
* **Highlighted Text:** Certain lines of reasoning are highlighted in red, indicating errors.
### Detailed Analysis
**Text Transcription:**
* **Graph Label:** `f(x) = |2x - 3| + 1`
* **Solution 1, Step 3:** "The derivative of `|2x - 3| + 1` is `2` for `x > 1.5` and `-2` for `x < 1.5`."
* **Solution 1, Step 4:** "For `x = 2`, the function is in the interval where `x > 1.5`, so the derivative is `2`." / "For `x = 5`, the function is also in the interval where `x > 1.5`, so the derivative is `2`."
* **Solution 2, Step 3:** "The function `f(x) = |2x - 3| + 1` changes slope at the vertex of the absolute value, which is at `x = \frac{3}{2}`."
* **Solution 2, Step 4 (Highlighted in Red):** "At `x = 2`, the function appears linear with a **negative slope** (since it's to the left of the vertex)." / "At `x = 5`, the function appears linear with a positive slope (since it's to the right of the vertex)." / "The slope at `x = 2` (negative) is steeper/more negative than the slope at `x = 5` (positive)."
**Reasoning Comparison:**
* **Solution 1 (Correct):** Correctly identifies that both x=2 and x=5 are greater than the vertex x-coordinate (1.5). Therefore, both points lie on the right branch of the absolute value function, where the derivative is constant and positive (2). Concludes the derivatives are equal.
* **Solution 2 (Incorrect):** Makes a critical spatial error. It incorrectly states that x=2 is "to the left of the vertex." The vertex is at x=1.5, so x=2 is actually to the right. This leads to the false assumption that the function has a negative slope at x=2, resulting in an incorrect comparison and final answer.
### Key Observations
1. **Contradictory Conclusions:** The two solution attempts arrive at opposite final answers (B vs. A) for the same problem.
2. **Source of Error:** The incorrect solution (Solution 2) contains a fundamental misreading of the graph's spatial layout, misplacing x=2 relative to the function's vertex.
3. **Confidence vs. Accuracy:** Solution 2 maintains moderate confidence scores (0.396-0.676) despite containing a critical logical error, highlighting a potential pitfall in automated reasoning systems.
4. **Visual Grounding:** The graph clearly shows both marked points (x=2 and x=5) on the same upward-sloping line segment to the right of the vertex, visually supporting the correct conclusion of equal derivatives.
### Interpretation
This image is a diagnostic tool that reveals how errors in **spatial grounding** and **graph interpretation** can lead to incorrect mathematical reasoning. The core task requires connecting the algebraic definition of a derivative (the slope) to its visual representation on a graph.
* **What the Data Suggests:** The problem tests understanding that the derivative of a linear segment (like the branches of an absolute value function) is constant. The correct reasoning (Solution 1) demonstrates this by analytically determining the derivative on the relevant interval. The incorrect reasoning (Solution 2) attempts a visual slope comparison but fails at the first step of correctly identifying which branch of the function each point belongs to.
* **Relationship Between Elements:** The graph is the primary source of evidence. The question asks for a comparison that must be derived from the graph's properties. The solutions show two different pathways to interpret that evidence—one successful, one flawed.
* **Notable Anomaly:** The most significant anomaly is the **factual error in Solution 2, Step 4**, where it claims x=2 is left of the vertex. This is not a subtle miscalculation but a clear misobservation of the provided visual data, leading to a cascade of incorrect inferences. It underscores the importance of precise visual grounding in multimodal reasoning tasks. The presence of the "Ground Truth: B" label confirms the correct answer, making the image useful for evaluating and debugging reasoning models.