## Diagram: Foundation Model Workflow
### Overview
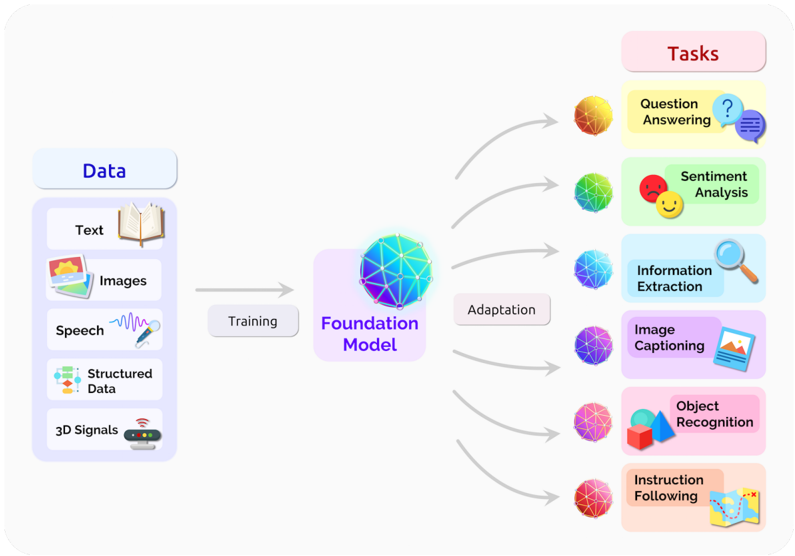
The image is a diagram illustrating the workflow of a foundation model, showing the data types used for training, the model itself, and the various tasks it can perform after adaptation.
### Components/Axes
* **Header:** Contains the labels "Data" and "Tasks" on the left and right sides of the diagram, respectively.
* **Data Sources (Left):**
* Text (represented by an open book icon)
* Images (represented by a photo icon)
* Speech (represented by a sound wave and microphone icon)
* Structured Data (represented by a flowchart icon)
* 3D Signals (represented by a device with antenna icon)
* **Processes (Center):**
* Training (arrow pointing from data sources to the Foundation Model)
* Foundation Model (a spherical object with a network of interconnected nodes, enclosed in a rounded rectangle)
* Adaptation (arrow pointing from the Foundation Model to the tasks)
* **Tasks (Right):**
* Question Answering (represented by a question mark and speech bubble icon)
* Sentiment Analysis (represented by happy and sad face icons)
* Information Extraction (represented by a magnifying glass icon)
* Image Captioning (represented by a picture icon and a laptop icon)
* Object Recognition (represented by a cube and a pyramid icon)
* Instruction Following (represented by a map icon)
### Detailed Analysis
* **Data Sources:** The diagram shows five different types of data used to train the foundation model. These data types are arranged vertically on the left side of the diagram.
* **Training:** An arrow labeled "Training" connects the data sources to the "Foundation Model," indicating that the model is trained using these data types.
* **Foundation Model:** The "Foundation Model" is represented by a spherical object with a network of interconnected nodes, enclosed in a rounded rectangle.
* **Adaptation:** An arrow labeled "Adaptation" connects the "Foundation Model" to the various tasks, indicating that the model is adapted to perform these tasks.
* **Tasks:** The diagram shows six different tasks that the foundation model can perform after adaptation. These tasks are arranged vertically on the right side of the diagram. Each task is associated with a specific icon.
* Question Answering: Yellow-orange sphere.
* Sentiment Analysis: Green sphere.
* Information Extraction: Blue sphere.
* Image Captioning: Purple sphere.
* Object Recognition: Pink-red sphere.
* Instruction Following: Red sphere.
### Key Observations
* The diagram illustrates a clear flow from data sources to the foundation model and then to various tasks.
* The use of icons makes the diagram visually appealing and easy to understand.
* The diagram highlights the versatility of foundation models, which can be adapted to perform a wide range of tasks.
### Interpretation
The diagram illustrates the general concept of a foundation model. The model is trained on a diverse set of data types (text, images, speech, structured data, and 3D signals). After training, the model can be adapted to perform a variety of tasks, including question answering, sentiment analysis, information extraction, image captioning, object recognition, and instruction following. This demonstrates the power and flexibility of foundation models in addressing a wide range of real-world problems. The diagram emphasizes the importance of training data and the adaptability of the model to different tasks.