\n
## Diagram: Foundation Model Training and Tasks
### Overview
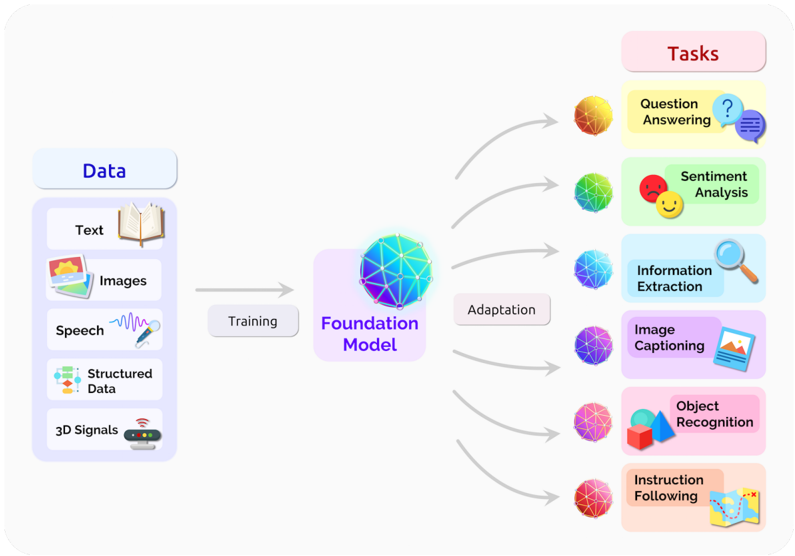
This diagram illustrates the process of training a Foundation Model using various data types and adapting it to perform different tasks. The diagram is segmented into three main regions: "Data" (left), "Foundation Model" (center), and "Tasks" (right). Arrows indicate the flow of information from data to the model during training and from the model to tasks during adaptation.
### Components/Axes
The diagram consists of the following components:
* **Data:** Includes Text (represented by a document icon), Images (represented by a picture frame icon), Speech (represented by a sound wave icon), Structured Data (represented by a table icon), and 3D Signals (represented by a radar/signal icon).
* **Foundation Model:** A central sphere labeled "Foundation Model".
* **Tasks:** Includes Question Answering (represented by a question mark and flag icon), Sentiment Analysis (represented by a smiley face icon), Information Extraction (represented by a magnifying glass icon), Image Captioning (represented by a picture and text bubble icon), Object Recognition (represented by a cube icon), and Instruction Following (represented by a computer screen and cursor icon).
* **Arrows:** Indicate the flow of data during "Training" (from Data to Foundation Model) and "Adaptation" (from Foundation Model to Tasks).
* **Color Coding:** Each task is associated with a unique color. These colors are used to trace the adaptation path from the Foundation Model to each specific task.
### Detailed Analysis or Content Details
The diagram shows a flow of information.
1. **Data Input:** Five data types feed into the Foundation Model during the "Training" phase.
2. **Foundation Model:** The central "Foundation Model" receives data from all five sources.
3. **Adaptation to Tasks:** The Foundation Model then adapts to perform six different tasks. Each task is linked to the Foundation Model via a curved arrow, colored to match the task's icon.
* **Question Answering:** (Orange) - The arrow originates from the Foundation Model and leads to the Question Answering task.
* **Sentiment Analysis:** (Red) - The arrow originates from the Foundation Model and leads to the Sentiment Analysis task.
* **Information Extraction:** (Green) - The arrow originates from the Foundation Model and leads to the Information Extraction task.
* **Image Captioning:** (Blue) - The arrow originates from the Foundation Model and leads to the Image Captioning task.
* **Object Recognition:** (Purple) - The arrow originates from the Foundation Model and leads to the Object Recognition task.
* **Instruction Following:** (Pink) - The arrow originates from the Foundation Model and leads to the Instruction Following task.
### Key Observations
The diagram emphasizes the versatility of Foundation Models. A single model can be trained on diverse data types and then adapted to perform a wide range of downstream tasks. The color-coding effectively illustrates the connection between the Foundation Model and each specific task. The diagram does not provide any quantitative data or specific performance metrics.
### Interpretation
The diagram represents a common paradigm in modern machine learning, particularly with the rise of large language models and multimodal models. The "Foundation Model" represents a pre-trained model with a broad understanding of data, which can then be fine-tuned or adapted for specific applications. The diagram highlights the benefits of this approach:
* **Data Efficiency:** Training a single Foundation Model on diverse data can reduce the need for task-specific training data.
* **Transfer Learning:** Knowledge gained during pre-training can be transferred to new tasks, improving performance and reducing training time.
* **Generalization:** Foundation Models are designed to generalize well to unseen data and tasks.
The diagram suggests a pipeline where raw data is transformed into a generalized representation within the Foundation Model, and then specialized representations are created for specific tasks. The use of different icons for each data type and task emphasizes the diversity of applications. The diagram is conceptual and does not provide details about the model architecture, training process, or adaptation techniques. It serves as a high-level overview of the Foundation Model paradigm.