## Diagram: Comparison of Machine Learning Paradigms
### Overview
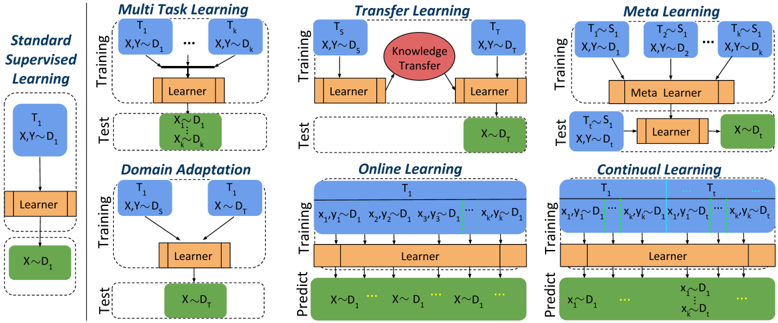
This image is a comparative diagram illustrating seven distinct machine learning paradigms. It uses a consistent visual language to represent data inputs, model training, and testing/prediction phases. The diagram serves as a taxonomy, showing how different paradigms handle data distributions ($D$), tasks ($T$), and knowledge transfer.
### Components/Axes
The diagram uses a standardized color-coded system:
* **Blue Boxes:** Represent input data, tasks, and distributions ($T$, $X, Y \sim D$).
* **Orange Boxes:** Represent the "Learner" or "Meta Learner" (the model).
* **Green Boxes:** Represent the "Test" or "Predict" phase outputs.
* **Red Oval:** Represents "Knowledge Transfer" (specific to Transfer Learning).
* **Dashed Boxes:** Grouping elements into "Training" and "Test/Predict" phases.
* **Arrows:** Indicate the direction of data flow and influence.
### Detailed Analysis
#### 1. Standard Supervised Learning (Far Left)
* **Training:** A single blue box ($T_1, X, Y \sim D_1$) feeds into an orange "Learner" box.
* **Test:** The Learner feeds into a green box ($X \sim D_1$).
* **Trend:** Linear, single-task flow.
#### 2. Multi Task Learning (Top Left of Grid)
* **Training:** Multiple blue boxes ($T_1, X, Y \sim D_1$ through $T_k, X, Y \sim D_k$) feed into a single orange "Learner" box.
* **Test:** The Learner feeds into a green box containing multiple outputs ($X_1 \sim D_1$ ... $X_k \sim D_k$).
* **Trend:** Many-to-one training, one-to-many testing.
#### 3. Transfer Learning (Top Middle of Grid)
* **Training:** Two distinct blue boxes ($T_S, X, Y \sim D_S$ and $T_T, X, Y \sim D_T$). The first feeds into a Learner. A red oval labeled "Knowledge Transfer" connects the first Learner to a second Learner, which also receives input from the second blue box.
* **Test:** The second Learner feeds into a green box ($X \sim D_T$).
* **Trend:** Sequential dependency where knowledge from a source task ($S$) informs the target task ($T$).
#### 4. Meta Learning (Top Right of Grid)
* **Training:** Multiple blue boxes ($T_1 \sim S_1$ through $T_k \sim S_1$) feed into an orange "Meta Learner" box.
* **Test:** The Meta Learner feeds into a second orange "Learner" box. This Learner also receives input ($T_t, X, Y \sim D_t$) and outputs to a green box ($X \sim D_t$).
* **Trend:** Hierarchical; the Meta Learner trains the Learner.
#### 5. Domain Adaptation (Bottom Left of Grid)
* **Training:** Two blue boxes ($T_1, X, Y \sim D_S$ and $T_1, X \sim D_T$) feed into a single orange "Learner" box.
* **Test:** The Learner feeds into a green box ($X \sim D_T$).
* **Trend:** Merging source and target domains to solve a single task.
#### 6. Online Learning (Bottom Middle of Grid)
* **Training:** A large blue block ($T_1$) containing a sequence of data ($x_1, y_1 \sim D_1$ ... $x_k, y_k \sim D_1$) feeds into a single orange "Learner" box.
* **Predict:** The Learner feeds into a green box ($X \sim D_1$ ... $X \sim D_1$).
* **Trend:** Sequential, continuous data stream processing.
#### 7. Continual Learning (Bottom Right of Grid)
* **Training:** A large blue block ($T_1$ ... $T_t$) containing a sequence of data ($x_1, y_1 \sim D_1$ ... $x_k, y_k \sim D_t$) feeds into a single orange "Learner" box.
* **Predict:** The Learner feeds into a green box ($x_1 \sim D_1$ ... $x_k \sim D_t$).
* **Trend:** Sequential data processing across changing distributions/tasks over time.
### Key Observations
* **Learner Centrality:** The "Learner" (orange box) is the constant component across all paradigms, acting as the processing engine.
* **Data Distribution Evolution:** The notation $D_1$ vs $D_S/D_T$ highlights the shift from static environments (Standard) to environments where the source and target distributions differ (Transfer/Domain Adaptation).
* **Sequential vs. Parallel:** Online and Continual learning are visually distinct from the others by using a wide, continuous blue block to represent the temporal nature of the data stream.
### Interpretation
This diagram provides a high-level conceptual map of how machine learning models are structured based on their learning objectives.
* **Standard Supervised Learning** is the baseline, assuming a static, single-task environment.
* **Multi-Task and Meta Learning** expand the scope of the training phase to handle multiple tasks simultaneously or learn *how* to learn.
* **Transfer Learning and Domain Adaptation** address the problem of distribution shift, where the training data (source) does not perfectly match the testing data (target).
* **Online and Continual Learning** address the temporal dimension, where data arrives sequentially, and the model must adapt without forgetting previous information (a key challenge in Continual Learning).
The diagram effectively demonstrates the progression of complexity in modern AI, moving from isolated, static problems to integrated, dynamic, and adaptive systems.